Blog Post 3 – Claire and Molly

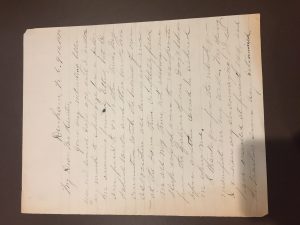
Durham, N.C 9-10-1890

My Dear Mr. Hunter,

                Your very interesting letter was read several days ago and I wished(?) very much to apologize for a delay in answering friendly letters, but I am pressed to do so this time. My school work and the work in connection with the business of our association all coming on me at the same time, completely filled in all may time not allowing me sleep enough even to reciprocate __ for the __ of one day’s labor before another would be ushered in after me.

                I thank you for the interest you manifest in my work. My opening I consider very encouraging. Here I have enrolled at present 144, and the teachers seem very determined. I assure you very few ___ could have felt more pleased than i did to hear of your success. There is certainly no doubt about it, that it certainly lightens one’s work to feel that he can get a living out of it. I long(?) ___ you.

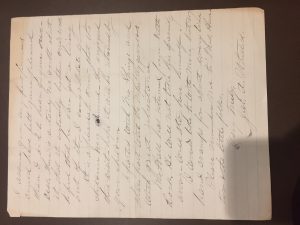
                It is a pleasure to know that the children were admired. They enjoyed their visit. Hope it will be followed(?) by your children. I parted with my things and shall part with the implicity (?) geralds (?) with great reluctance.

                Mr. Hall has returned from Little hoch(?). He will not take his family away – will stay here himself.

I would like to write more, but hand cramps for about every time.

Please remember me to Mrs. Hunter for and the little folks.

Very truly,

Jas. A. Whitted

Morgan -Blog Post 2: Tax List

In class we looked at an 1875 tax list of the residents of Orange County. One prominent component of the tax list, that I would not have even thought about, was the idea of animals as property. Today, animals are seen as pets for the most part; however, in 1875, animals were a large portion of the property that residents were taxed on. If we have a chance to look at the tax list again, it would be interesting to see if certain animals were taxed more than others. If so, I wonder if the differences had to do with the expense of maintaining an animal or the value of the products that the animal produced. Southern Crossing explains how prevalent farmers rights were during the late 1800s, as many farmers felt that their taxes were unfair and too high, especially in comparison to other business owners. Southern Crossing mentions that this added to political tensions, as the Democrats played off of the farmers’ frustration by offering to “roll back” taxes in an attempt to gain the support of farmers. Another element of Durham during 1875 that the tax list revealed is that the majority of the people on the list were men. If there were women listed, it was often because they were widows. This says a lot about the gender roles during that time. While today, many women have their own property and finances even when they get married, back then it was clear that the men were the financial leaders of ay household. Southern Crossing also touches a bit on the different gender roles that were in play. It explains that on the railroad, in particular, there were two “classes” of cars. The first class car was reserved for white men and women who did not use tobacco, while the “second-class car” was for men who used tobacco, men traveling without women companions. The second class car was also much cheaper, as the atmosphere allowed behaviors that were not acceptable in the first car. While these rules do not explicitly state different gender roles, it is clear that it was more acceptable for men to travel without women companions, but that those men were not to be trusted around other women, and it was more acceptable for men to use tobacco. While this tax list opened my eyes to many characteristics and societal norms of Durham during that time period, it also left me with many questions. For one, I wonder if there were some people who did not pay taxes or who the tax list “missed,” whether that be someone who moved around often or ran businesses that were somewhat secretive. I also wonder how quickly a woman would be added to the tax list after her spouse passed away or when a woman who did not get married would be “separated” from her father’s financials and property. One thing that I do not remember noticing was whether there was jewelry, art and other more personal belongings on the tax list. While they might have been there, these items were clearly not the key component of the tax list. Finally, the tax rate today can vary depending on ones’ income, however I did not notice if there was a difference in how people were taxed on the 1875 tax list.

Personally, when I was looking at the Digital Durham website I focused on the maps and photographs rather than the letters because I tend to be a more visual learner when it comes to history. I looked at the 1914 map of Durham and the suburbs as well as the 1983 map of Durham. In my analysis of the 1914 map, I discussed how it might relate to education. However, in class it was pointed out that while roads and highways were the focus of the 1983 map, railroads were the focus of the 1914 map. After reading about the significance of the railroads and the importance they played in the South in the late 1800s and early 1900s, it seems more fitting that the the railroads were the key component of this map rather than the location of schools. If I were to analyze this map again, I would focus on the relationship between where the railroads are located in relation to the business districts versus the residential and suburban areas of Durham. Today, suburban areas and business areas tend to be split. In my town, the “downtown” is where the train stops, most of the restaurants and stores are while the neighborhoods usually only have schools and homes. There are some apartments above businesses and some houses surrounding the downtown, but these are not the prime locations to live in town. These maps, however, reveal that the city was truly built around the train station and there was more intermixing of business and living areas.  While having a train near your house often devalues ones’ property, we discussed in class how the wealthiest families often used to live near the train.

Blog 2- Mapping it all out (Tilahun)

http://digitaldurham.duke.edu/images/full/dduma010250010.jpg

While looking through different things in the Digital Durham Archives, I was particularly interested in a map I saw. I chose a map because most other times, I would have chosen a photo, or letter but I wanted to see what a map (something I seldom use) can reveal about a city I didn’t know much about.

The map was made by Durham, (N.C.). Department of Public Works in 1930. The map’s target audience seems to be developers, and public officials who would benefit from this information provided on the map. The map is detailed in the names of the streets, as well as the size of the sewage lines across the city.

The map itself and how it was constructed was very interesting. The two main focal points of the map were street names, and sewage (size and location). So, the legend focused on these two things, outlining the names and locations of the streets, as well as a key outlining how different color signified a different size sewage. The map shows signs of edits and corrections as the city developed and new roads and sewage systems needed to be added. Interestingly, the larger sewage systems are found more on the outskirts of the city (more specifically towards the NE part of the city). I found it interesting that the larger sewage lines were clustered in certain locations because this may reveal something about the reason to which this was a thing. Unfortunately, I found it hard to match the map from 1930 to the current map of Durham due to how much the city has developed since then.

But a few of the streets that remain with the same name were Yearby, Erwin and Lewis which are all familiar streets on campus. Using that as an anchor point, and using a ‘financial’ map of Durham, I tried to make a comparison between socioeconomic development of certain parts of the city today, and the sewage sizes in 1930. Not surprisingly, there were many correlations. Although this is nothing conclusive, this really sparked my interest in how much technical documents can actually show. Overlaying this one technical map with maps that show current Durham’s development, wealth distribution, racial classification and education system, one could learn a lot about how the city came to be within the context of history, law and other factors that still continue to affect the city.


Blog Post 2

During last class we spent time looking tax lists from 1875. The first thing that struck me was that the majority of white men were those who owned land. This was clearly highlighted by the first column of the table which tallied the Number of White Polls. However  I quickly remembered that Edward L. Ayers’s Southern Crossing discussed how nearly 200,000 black farmers managed to purchase their own land. (Ayers pg. 508 of Southern Crossing e-book).  In addition, Ayers also discussed how the increase in black land ownership was one of the characteristics of the era which he describes as the “New South.” Although land ownership does not guarantee an easy life, the statistic from the Tax List of 1875 of the number of black men who owned land makes me question if blacks had the same opportunities in Durham as they did in other places throughout the region.  Another thing discussed in class that caught my attention, was that those who had the highest value for their personal property usually tended to live closer to railroads. Once again, when thinking back on Southern Crossing I realized why this made sense. Ayers spends a great portion of chapter one discussing how the railroad completely transformed the region. He describes the railroad station as the main feature of the town and states how nine out of ten southerners lived in a railroad county (Edwards pg. 948 of Southern Crossing e-book).  This also explains why in the maps on Digital Durham, the railroads were often in the center of the town. This contrasts with today’s society as railroads are no longer the main mode of transportation and those wealthiest in the town tend to live further away from the railroad lines. Finally, the last thing that struck me from the tax list was how animals were taxed. Animals such as horses, mules, and jacks were considered property of a landowner. In addition I found that the more animals the land owner possessed, the wealthier he tended to be.  This fact also stresses the idea that the South was still fairly agricultural during the New South era despite having made some advancements toward diversifying their economy.

Blog Post 2 – Xiao

The archival materials I examined in class and on the Digital Durham website revealed a lot about daily life in Durham and issues relevant to people back then.

The Orange County tax list from 1875 sheds light on what was considered valuable. The headers include the numbers of animals and land acreage people owned. Landowners like Washington Duke had more land, more animals, and thus, more wealth. It was also very interesting to see names I recognized, like Washington Duke, in the tax list. For me, I don’t know much about Durham history, so being able to learn more about Durham’s key historical figures was fascinating.

I think the tax list also highlights the importance farming still had in the new South. Many people, both blacks and whites, were farmers. As Ayers explained, after the Civil War, angry farmers formed alliances or groups to champion more representation for farmers. And the tax list demonstrates that owning animals and planting crops were activities important to making a living.

Furthermore, I also discovered a lot from some of the archival materials I noticed on the Digital Durham website.

For instance, I looked at Emerson’s North Carolina tobacco belt directory in 1886 which lists businesses within the corporate limits of Durham. Also listed in the directory are the names of proprietors, stores’ locations, and the products sold. Businesses owned by people of African American heritage are denoted with an asterisk. Such a document could help someone research the industrialization and urbanization of Durham–an emblem of the New South. The directory provides glimpses into life in 1886. Many of the names in the directory sold tobacco, and even ads, such as the cigar ad on page 6 or the multiple page spread starting on page 27 of Allison & Addison’s Star Brand Tobacco, illustrates the growing prevalence of Durham tobacco. The thriving tobacco industry would soon lead to rapid increases in population and business in Durham.

In this time period, relations between blacks and whites were strenuous, and many black weren’t afforded fair rights, but some had more opportunities and were able to receive educations and distinguish themselves. Although many were relegated to becoming sharecroppers, there still existed more opportunities for African Americans–as some of the directory entries show. Some owned grocery stores, others barber shops, and still others ventured into tobacco.

Other maps on the site underline the prevalence of railroads in Durham. Railroads were a technological innovation that helped increase urban growth; however, they were also sites of tense racial clashes. Because railroads contained the same facilities, whites and blacks sometimes get entangled in violence. Some railroads created separate cars, one for blacks and one for whites–a pricey and unprofitable endeavor. Other trains used two different classes, and sometimes, forced African Americans to use second-class facilities even when they’d paid for first class.

The archival materials can help provide more context and explain some of the issues Ayers discussed.
Mapping It All Out – Black / Post 2

While looking through the archive collection that is found on Digital Durham, I found myself spending more time looking at the maps. As a visual learner, I grew interested in the photographs as well, but the multitude of maps that was displaying very similar information was captivating to me. In particular, the Durham Annexation Map received a lot of my time.

While looking at the annexation map, I quickly noticed the different patterns. Not understanding what annexation exactly meant (at first), I thought that it coded for certain areas of town. Shortly after, realizing that annexation referred to the expansion or “takeover” of certain areas at certain points in time, I began to more look more intently at all of the small details. After 1925, Durham started growing massively. Starting at 1957, Durham’s annexation was increasing upon the x and y component very broadly – almost like the square footage increased by at least 25% each period. It appeared to have farm plantations and large parcels of land toward the North and East sides of Durham. Starting in the 1990’s, I started to recognize that very small extensions of the boundaries were becoming more frequent and the Central (town boundaries) of Durham were probably beginning to get more heavily populated.

Since I have lived in Durham for almost 3 years, I have been able to decently explore the city and the different parts. Since I became an education minor, I grew interested in how Durham was structured, what demographics were present in certain areas, and how the areas compared to others. The viewing of all of the maps sparked questions I had related to social structure. I’m interested to see how the North and East neighborhoods/areas compare to the commercial area of Durham as far as class, race, political views, etc. I wonder if individuals that lived in these more distant areas were against annexation, because they may not have to share county existence. I also wonder how the urbanization of Durham has changed individuals’ idea of “home” or how the neighboring areas feel. I wonder how neighboring areas or “distant” annexed areas feel, because from my understanding annexation collects more tax revenue to be utilized in the new boundaries. Did the residents have a say? What is the history behind the annexation? Knowing that other cities like San Antonio and Fayetteville are facing conflicts with annexation, it leads me to wonder how Durham has dealt with its municipal expansion.

Wenger- 1875 Tax List (Post 2)

While looking at the Durham section of the 1875 tax list, I was immediately drawn towards the names which I recognized. With my limited knowledge of Duke’s history and knowledge of building names around campus, I first looked for members of the Duke family. Seeing Washington Duke’s worth in comparison to some of the other people in the town makes me see how disproportional the wealth was distributed. Although a small amount of people had animals and large amounts of land, it reminds me of how wealth is still distributed in the modern age. In 2017, the top 1% earned 82% of the wealth and I can only think that the same existed back then.

Besides the large disparity in wealth, I noticed how the column headers were labeled. The inclusion of animals in taxation makes me think that taxation was more for those who owned farms. This idea however was questioned also by the graph by having different values associated with different plots of land. Knowing that Washington Duke had the prime real estate on the train tracks allows me to try to understand the distribution on land worth and correlation with animal ownership. Although not exactly accurate and based partially on logic, it seems animal ownership might mean more rural land and thus less taxes from land ownership. It also surprises me that some of the columns were completely empty for people with the same surname. Almost as if they had little to no possessions or social status and thus were taxed lightly.

Continuing on looking at family names, I noticed that if one member of the family was worth more than $5,000, that more individuals with the same name had money. The same goes on the opposite spectrum with individuals commonly having little valuables when family members also having limited funds. This makes sense due to privilege but it does not explain why family members were often not written next to each other on the page. For organization purposes, pages have the same letter last names next to each other but seemingly no organization between the names on the page. Overall, I feel like this tax list gives insight into the administrative system in place in Orange County but raises more questions in me instead of answering.

Hendrix Post 2

I enjoyed looking through the Orange County Tax List and was surprised how much information could be gleaned from a seemingly routine document used for book-keeping.

Skimming through the entire document allows me to estimate that roughly 30% of individuals in Durham between the ages of 21 and 50 were black, while around 70% were white. It first struck me as odd that races were distinguished in this tax document – the poll tax was $1.20 for both white and black individuals, so why would one create separate columns in a spreadsheet that was meant to keep track of taxes? This allows us to look at this document like a census sheet and a finance sheet instead of only the latter. After I read the Southern Crossing chapters, particularly Chapter Five “In Black and White,” this decision made sense in light of the race relations of the day.

I thought the marks made for the poll tax were tallies, because I could only find 1s, until on page 138 I came across a 2 in the white polls column. The name looks like Rawls and contains 4 letters after it that appear to be L C S A. They have no town lots, land, or animals, but they own stocks in merchandise and have highly valued personal property. This could potentially be a company.

In class, we looked at Washington Duke’s tax records. I wanted to see what I could learn about Pauli Murray’s family. Although she was born in 1910 in Baltimore, she moved in with her grandparents in Durham at the age of 3, so I hoped to find information on Robert and Cornelia Fitzgerald. However, I could not find their names. The Fitzgeralds had lived in the Durham-Chapel Hill area since 1869, but they may have been listed under Goldsboro or Hillsborough for taxes. As I continued to search through the document, I found a woman named Mildred Cameron who had a land evaluation at a staggering $7500. She was the daughter of Duncan Cameron, who was a lawyer who gained a fortune while investing heavily in land and buying stock in banks. After his death, she likely inherited much of her father’s land.

I am curious how much of the transcription process could be automated. There have been advances in handwriting recognition through optical character recognition programs, but cursive has always proved a challenge – particularly the style seen in this document. If not the names of individuals, the writing in other columns could potentially be read by a computer, as the numbers are extremely clear. However, the occasional spots of ink throughout the document (and places where a 1 is crossed out with a dash) might prove to be a problem.

Blog Post — Xie

I first noticed that the Orange County List 1875 is preserved in a relatively good condition. Unlike some counties that have suffered from many court house fire and as a result lost track of their tax records, this tax list is maintained in a good condition – it’s easy to read the headline, column headings and contents in each column. 

Continue reading “Blog Post — Xie”

Introduction!

Hi everyone! My name is Victoria. I am a sophomore studying computer science here at Duke. I am from Miami, where I have lived my entire life. On campus I am involved in GANO, a volunteer program that teaches English to Native Spanish speakers. In addition, I am also a member of the web design team for The Standard. I am excited to learn more about Durham’s history as well as incorporating my interest in technology throughout this course.