
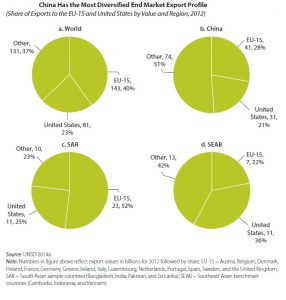
Currently, the major manufacturers of apparel are concentrated in three main regions in Asia, which are highlighted in circles in the map above. These regions are China, the South Asia Region (SAR) and the South East Asia Region Benchmark Countries (SEAB). The SEAB region includes Viet Nam, Indonesia and Cambodia, whereas the SAR region includes Bangladesh, India, Pakistan and Sri Lanka. The regions marked by rectangular boxes in the map, United States and the European Union, are the biggest importers of apparel.The importing regions have significantly established retail chains that generate demand that cannot be met domestically in a cost competitive manner due to higher wages, especially after the Multi fibre Agreement (MFA) been phased out, thus they need to rely on exports from the exporting regions. You can read more about MFA in the International Trade Policies and Politics section. The major manufacturing regions and their export locations can be seen in the chart below.
While the MFA was first put in place in the 1970s, the manufacturing segment of apparel was much more dispersed throughout both the developed and developing countries, but the importers of apparel were roughly the same as today. At that time, the SAR region and the SAEB region were not key players in the industry, and the main manufacturers in the Asian continent was concentrated in East Asia with countries including China, Taiwan, South Korea, etc. As big producers from developing countries such as China, Hong Kong, South Korea and Taiwan were starting to reach the maximum levels of the set quotas to export to US and EU, they set up factories in countries like Bangladesh, Viet Nam, Cambodia and Sri Lanka who had not used their quotas yet. This marked the start of the apparel manufacturing industry in the SAR and SEAB regions, and fragmented the global value chain of apparel.
After the MFA was phased out in the 1990s, the tariffs and quotas to limit the low-cost producers in developing countries were removed, thus the developed countries could not longer compete with its more cost competitive counterparts. This lead to a significant geographical shift in the manufacturing segment of the apparel industry, and very few manufacturers of apparel remained in the western developed countries. The apparel manufacturing industry was consolidated further as wages within some of the developing countries such as Taiwan and South Korea started to rise, and they moved on to higher value products.
In the early 2000s, countries which were least industrialized were given preferential end market access through the “Everything But Arms(EBA)” and “Generalized Scheme of Preferences (GSP)”, allowing Least Developed Countries (LDC)s to export to EU, etc. without any tariff. This, coupled with the economic crisis in 2008-2009 led to further consolidation of the apparel manufacturing industry, as the exporters of apparel started being concentrated within China, SAR and SEAB.
Overall, the primary apparel exporting countries can be placed into the following categories:
1. Increasing or steady global market share
- China − The clear winner in the global apparel export race during the past 15 years. Between 1995 and 2015, China’s share of global apparel exports increased from 22% to 39.3%, representing an increase in value from $32.9 billion to $175 billion.
- Growth suppliers − Overall, these countries have increased global market share since the early 1990s and through the economic crisis: Bangladesh, India, Vietnam, Indonesia, Sri Lanka, Pakistan, and to a lesser extent, Cambodia.
- Steady suppliers − EU-15, Turkey, Tunisia, and Morocco. These countries increased export values until the effects of the economic crisis were felt in 2009, but managed to maintain relatively stable global market shares through the quota phase-out and recession.
2. Decreasing global market share
- Decline with quota phase-out − These countries experienced declines during the MFA/ATC quota phase-out (1995–2005) that have continued during the crisis: USA, Canada, Mexico, DR-CAFTA, Thailand, Romania, and Poland.
- Past-prime suppliers − These countries were once leading apparel exporters, but their global market shares have been decreasing since the early 1990s: Hong Kong, South Korea, Taiwan, and the Philippines.
In the future years, there is a chance of a larger shift in the apparel industry as the wages in China increases, making it less cost competitive, and its share of the market moves either to the SEAB or the SAR countries. Although China remains the world’s largest apparel exporter, apparel as a share of its total exports in 2012 accounted for only 7.1 percent—about half of the 15.6 percent in 1990 . Since apparel is a labor-intensive industry, a 10% increase of wages in China will significantly affect whether it continues to be competitive in the industry or not, and leaves a significant opportunity for a shift in the global value chain of apparel.

The chart above shows that the SEAB countries will probably fare better than the SAR countries in terms of capturing the market share that China loses in the future. This would be especially because of SEAB countries perform better in terms of logistics and has lower tariffs on the import of diversified raw materials such as Man Made Fiber, making it product offerings as diverse as demanded by the market, as we can compare in the charts below.


If the apparel industry sees a significant increase in the demand of wearable technologies, there is a possibility of a huge shift in the apparel global value chain, since developed countries with their technological expertise and capital base, will start to gain strength as manufacturers of such apparel. There does not seem be a a huge change in the main importing regions of apparel. However, developed nations that are not in the US or the EU have been importing more apparel than in the past, details of which you can see in the Key Industry Players in Design, Marketing and Sales page.