
Democracy is typically equated with expressing the will of the people through government. In a Republic, the people elect representatives who then act on their behalf and derive their political mandate from having won the election.
Possible corruption of the electoral results is often framed in terms of voter suppression, voter fraud, or the undo sway of money on people’s votes. Once the votes are collected, once the access to information and the ballot box is unfettered, all that remains to register the will of the people is to count each vote once and only once.
Yet, by varying how districts are drawn one can cause tremendous variation in the outcome of the elections without changing a single vote. There is so much variability, that one might wonder if the effect is greater all the previously mentioned effects combined.
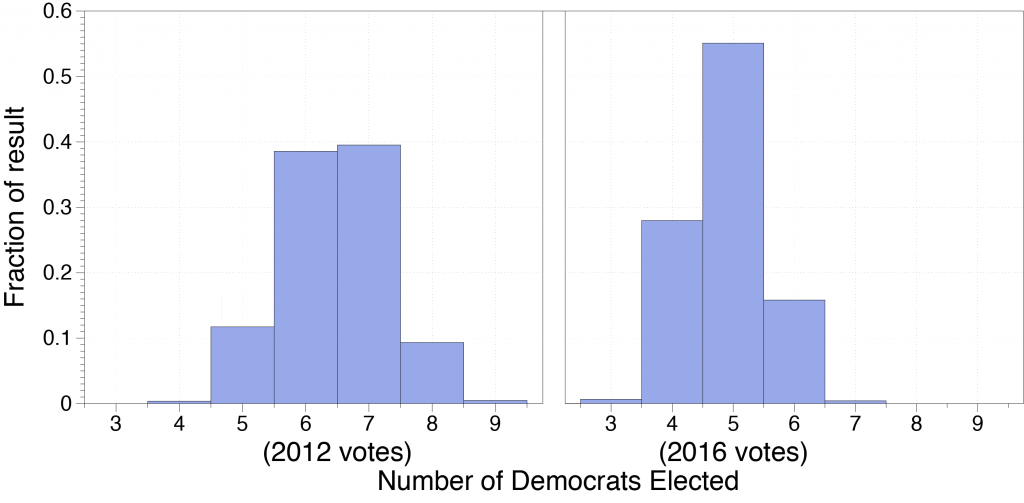
To explore this we generated over 24,000 redistrictings of the state of North Carolina. The redistrictings satisfy certain non-partisan design criteria and do not use any political data. When using the actual votes cast in US Congressional elections, we find the redistricting plans give anywhere from 4 to 9 elected Democrats for the 2012 voting data, and anywhere from 3 to 7 Democrats when using the 2016 voting data.
The following histogram gives the full distribution of outcomes with their frequencies. Clearly some outcomes are more prevalent than others. One might argue that results which are more prevalent better represent the will of the people as encoded in the votes.
With such wide variability, it seems clear that there must be checks and balances to limit which redistricting plans should be adopted.
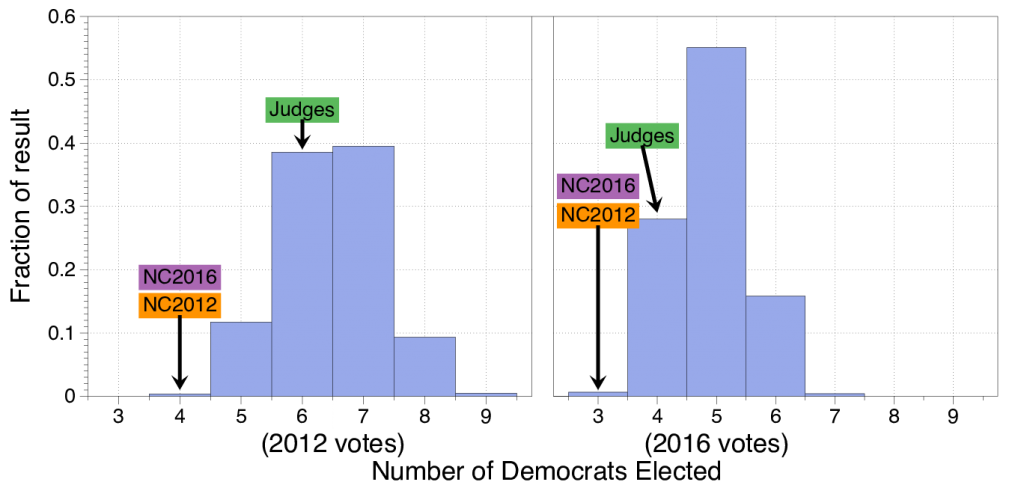
We close by placing the results given by the Congressional plans used in the 2012 election (labeled NC2012), in the 2016 elections (labeled NC2016), and the plan drawn by a bipartisan commission of retired judges (labeled Judges) in the Beyond Gerrymandering Project.
What form the checks and balances might take or what metric or procedure should be used in the evaluation of a specific redistrictibg plan is a topic of debate and current research. Given, the wide variation in outcomes, some principle to move forward seems needed, less the choice of map become more important to the election outcomes than the details of the vote.