Up until now, this blog has investigated whether gerrymandering has occurred. In this post we begin to investigate where gerrymandering has occurred. The question of ‘where’ is interesting for both scientific and legal reasons. Scientifically, one may want to determine which precincts were atypically manipulated to achieve a political goal. Legally, an argument for individual harm is needed to pursue suits based on 14th amendment claims: Whitford vs Gill was decided on standing and dismissed because the plaintiffs did not establish that they had been individually harmed by the redistricting process.
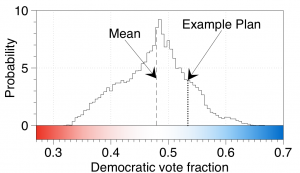
In this post we explore the merits of a particular measure of localized gerrymandering. The idea is a simple one and continues to rely on the ensemble analysis that we have already employed. Any given precinct will always lie within some district; given historical vote counts this district will have a democratic vote fraction. For a given precinct we can construct a histogram of all democratic vote fractions over all maps within the ensemble for a fixed historical election. Then, given some reference map, we can ask how atypical the precinct’s observed margin is, given this distribution. If a precinct lies within a district that has a much higher democratic vote fraction than expected, we will color it blue; if it lies in a district that has a much higher republican vote fraction than expected, we will color it red. We color based on the log-likelihood of of the cumulative distribution functions (e.g. more red means there is a low probability that the likelihood of finding a more Republican district is small). We first give an example distribution of the vote fractions of a precinct’s districts along with how we color them

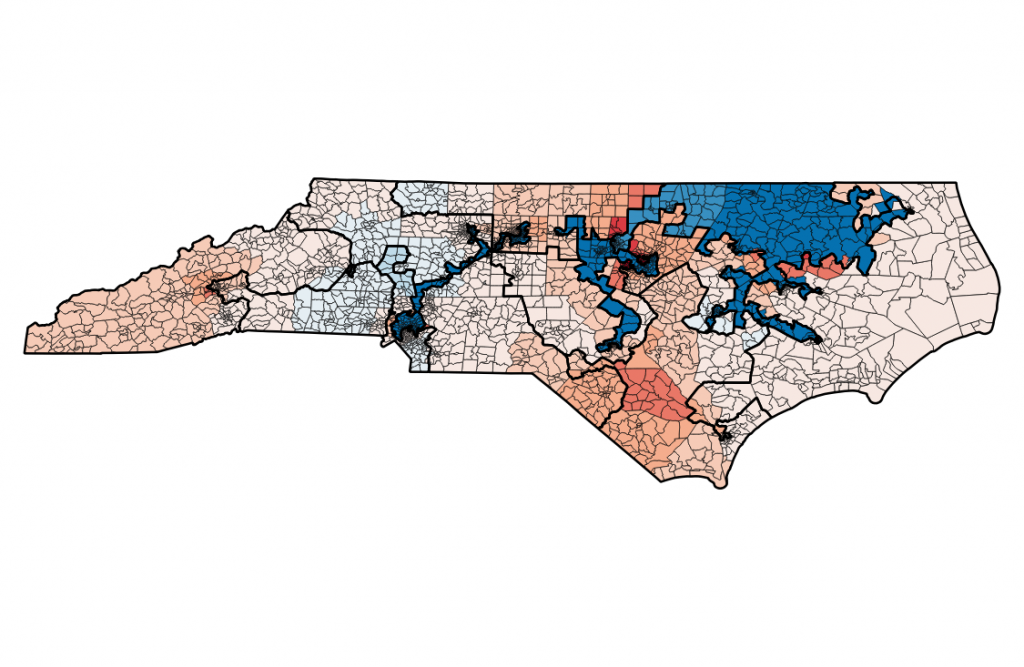
Using the votes cast in the 2016 congressional election, we color the district maps for NC2012, NC2016 and the Judges plan, respectively:


In both the NC2012 and NC2016 maps, this analysis reveals the democratically packed precincts/districts in dark blue; such precincts include those in Raleigh, the Northern coastal plains, Durham, Orange County and Mecklenburg. Both plans also reveal anomalously cracked precincts (primarily appearing on the boarders of the packed districts). In contrast, the Judges map is nearly entirely shaded lightly, suggesting precincts that are well within acceptable ranges of the ensemble of vote fractions.
The above maps provide a heuristic for localized packing and cracking, however they do not tell the full story. For example, we may gain a sense of which districts have been packed, but not whether this packing has generated an atypical result. Furthermore, although the box plots reveal three significantly cracked districts, the localized analysis makes it difficult to determine which of the districts are cracked. We hypothesize that there isn’t a good answer to this — many of the precincts could be in a district with low democratic vote fraction and be considered perfectly typical; the problem is that more precincts are in districts with low democratic vote fractions than is typical (the idea of more is precisely what the box plots reveal). Furthermore the exact precinct which are an outlier could fluctuate from one outlier map to another hence washing out many over localized signal. The route of the difficulty is that a percent is a small unit relative to the size of a district. (in North Carolina a few thousand (?) people at most in a district of half a million.) The global character of a district can be preserved while including or excluding in particular precinct. Yet there is a “push-and-pull” nature to the construction of a map. If if a map is globally an outlier when all districts are consider then there likely must be locations which are outliers from a more local perspective.
Despite these issues, one may be able to make an argument that the presence of precincts in a district with an atypical vote margin is enough to indicate harm. But what if every map had some precinct that was atypical — should the residents of this precinct have standing to claim they have not been protected?
One way to address this problem is to ask what a typical number of outlying precincts are; if there are a greater number of atypical precincts than to be expected, then perhaps a case for harm could be made: As an analogy, suppose you take a medicine, you are told you have a 5% chance of losing your leg, and you end up losing your leg; if 5% of people taking the medicine lose their legs, then you have no standing; however, if 50% of people lose their legs then you would have standing. To determine whether there are more atypical districts than usual, we consider the ensemble of maps and plot a histogram of the number of precincts that are 95% outliers given the statistics of the 24,000 maps in the ensemble. We then compare the number of 95% outliers in the NC2012, NC2016 and Judges plan.
 There is a wide variation in the potential number of outlying precincts: The number of outlying precincts varies from 8 to over 1000 in the ensemble. The judges plan contains one of the more typical number of outlying precincts at 154. In contrast the NC2016 plan contains 761 outlying precincts, and the NC2012 plan has 1115 95% outlying precincts. Over 99% of the plans in the ensemble have fewer outlying precincts than the NC2016 plan. None of the ensemble plans have fewer outlying precincts than the NC2012 plan. Thus we make a case that there is an atypical amount of harm in the NC2012 and NC2016 districting plan.


We have also explore variations on this theme such as tabulating the average log likelihood over a map (rather than count the number of outliers) and then again situate it in the ensemble. We will explore this and other variations on the theme in future works and papers.
Andrew Chin (UNC Law)
Greg Herschlag (Duke Math)
Jonathan Mattingly (Duke Math)
