
Obesity
Body Mass Index (BMI) Impacts Tibial Cartilage Deformations
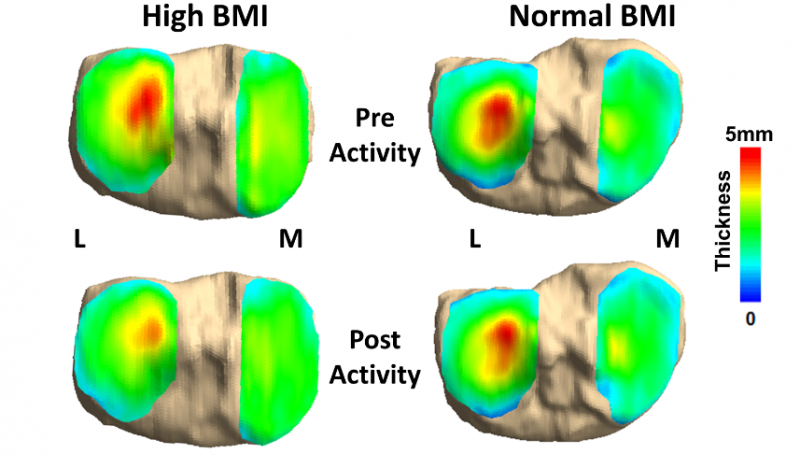 Representative tibial cartilage thickness maps from a high BMI subject and a normal BMI subject. The color thickness maps demonstrate greater changes in the high BMI subject’s tibial cartilage thickness compared with the normal BMI subject following the 20-minute walking task in both the medial (M) and lateral (L) aspects.
Effect of Diet on Murine Cartilage Stiffness
 Representative force-indentation curves for normal and high fat diet groups obtained via atomic force microscopy (AFM)-based nano-indentation testing of murine femoral condyle cartilage.