
Joint Mechanics & Exercise
Running-Induced Changes in Knee Cartilage
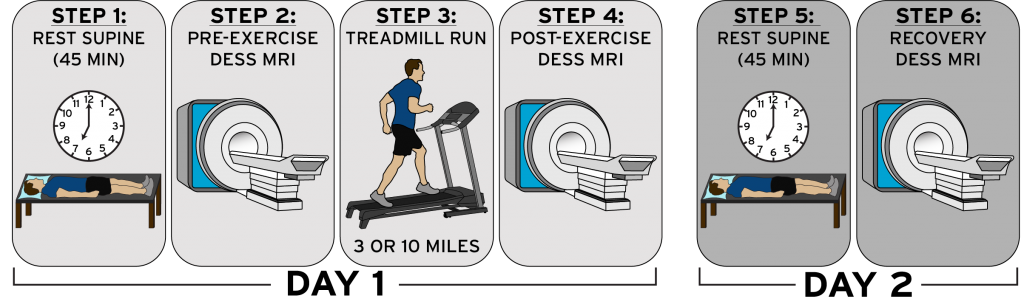
Each participant completed a multi-visit magnetic resonance imaging (MRI) and exercise protocol. The first testing day consisted of a 45-minute rest period followed by a baseline (pre-exercise) double echo steady state (DESS) MRI, a 10-mile run on a treadmill at a self-selected pace, and a post-exercise DESS MRI. The participants returned the following morning for an additional 45-minute rest period followed by a recovery DESS MRI. The entire protocol was repeated 2-3 weeks later, but each participant instead ran 3 miles at his mean mile pace from the 10-mile run.

(A) Patellar cartilage thickness maps for a single participant generated from the pre-exercise (PRE), post-exercise (POST), and recovery (REC) magnetic resonance imaging scans for both the 3- and 10-mile runs. Red represents areas with thicker cartilage, whereas blue represents areas with thinner cartilage. (B) Patellar cartilage strain maps for a single participant, quantifying the immediate effect of the 3- and 10-mile runs. Red represents areas in which the cartilage thickness decreased (compressive strain), whereas blue represents areas where the cartilage thickness increased.

T1rho maps for a single participant before, immediately after, and 24 hours after running 10 miles (16.1 km). Red and blue are indicative of regions with high and low T1rho relaxation times, respectively.
Pushups Impact Glenohumeral (Shoulder) Cartilage

MR segmentation of humeral head and glenoid bone and cartilage surfaces.

(A) Glenoid cartilage thickness maps. Blue represents the thinnest cartilage, while red represents the thickest cartilage. (B) Significant cartilage thickness changes (mean ± 95% CI) were observed at the humerus (*P = .002) and the glenoid (*P = .003) immediately after push-ups. A, anterior; I, inferior; P, posterior; S, superior.