
Have you heard of the expression, a picture paints a thousand words? Visualizing data is a very useful technique to get an overview of data, and perform a quick analysis. For example, when you look at a column of totals just numerically, it is very hard to get a feel for the general values, comparatively speaking. It is hard to notice subtle differences between the totals, or determining the highest and lowest amounts. Additionally, it is hard enough when you have just 10 to 20 rows, but imagine if you had hundreds of rows.
Producing visual displays for totals is a great way of analyzing data, but you may have too many data points, too many rows, for the traditional bar or column charts. Too many data points can clutter a standard bar or column chart.
1. REPT Function

Notice in cell C2, the REPT function is written as =REPT(“|”,B2/100). The division by 100 is use done to shorten the length of the data bar. The formula is then copied to the rest of the cells in column C.
2. REPT Function
Conditional formatting is a very powerful and useful feature for representing numerical data. While many people think of the word formatting as applying only font or color formatting, one of the most effective features of conditional formatting is using color data bars, as seen below in Column D. Conditional formatting data bars automatically use the highest and lowest values of data, and determine the length of the data bar to represent the data values (the totals in this example).
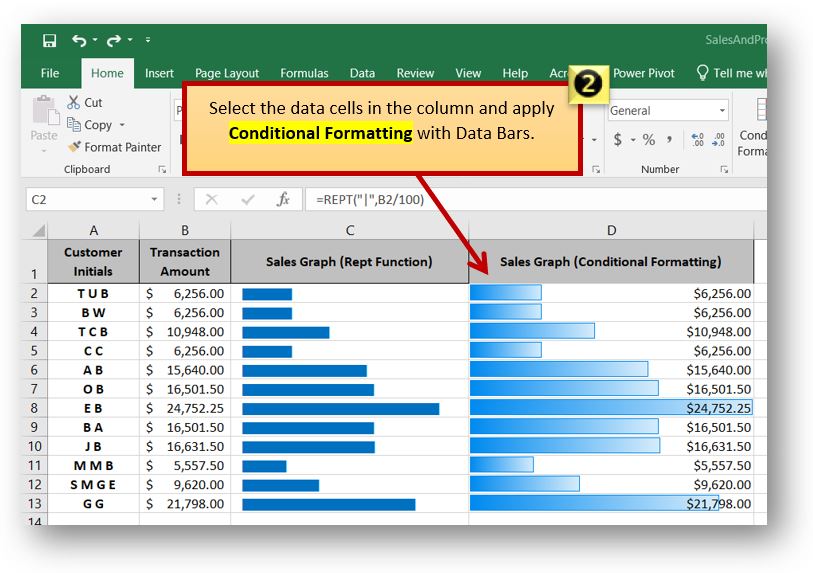
In both methods, notice how you can see which data is the highest and which one is lowest, and also the subtle differences between the values. For example, you can see that rows 8 and 13 have the longest bars, the highest values, but row 8 is slightly longer, and has the highest value. The lowest value in both is in row 11. Such quick analysis is not only valuable and time saving, you can also copy the formula of formatting to new rows of data.
This is very helpful. I follow the first one, don’t quite understand the 2nd. I can do the formula and the conditional formatting. I don’t understand how to get the value and the bar in the same column?