


Courtesy of Anantha Divakaruni and Howard Jones
Eugene Schieffelin was a Shakespeare fan determined to introduce to the New World every species of bird appearing in the works of The Bard. In 1890 he released 100 of the European starlings mentioned in Henry VI in New York’s Central Park. Schieffelin’s starlings multiplied quickly and spread across America, with official estimates putting the starling population today at 150 million. Starlings have wreaked havoc on native bird species by competing for food and spreading disease. Their penchant for destroying crops has also proved disastrous for American agriculture and economy.
The unintended consequences of recent regulatory changes to US capital markets make them a fitting parallel to Schieffelin’s starlings. US public markets have shrunk over the past two decades as the number of companies going public has plummeted. Policymakers were quick to blame federal securities laws that had grown ever more stringent (especially the Sarbanes-Oxley Act enacted following major accounting scandals in the early 2000s), thereby increasing the regulatory costs of being a public company. Given how public markets are considered vital for economic growth, the US government attempted to stem the decline in publicly traded companies, and kickstart economic growth post-financial crisis, by passing the Jumpstart Our Business Startups (JOBS) Act in 2012. However, as we show in our paper, the JOBS Act has simultaneously incentivized poor quality firms to go public and eased private capital raising that, in turn, has encouraged many firms to eschew the public markets. Together, these outcomes have stifled the Act’s efforts to revive US public markets.
Features of the JOBS Act
The JOBS Act sought to reverse the IPO decline by relaxing the onerous regulations required to become and remain a public company. Title I of the Act reduces the cost of going public. It designates firms with annual revenue below $1 billion as emerging growth companies (EGCs) and exempts them from certain disclosure and registration requirements that reduce the costs of filing for an IPO. EGCs can retain this status for up to five years after the IPO, and they can raise additional equity through secondary public offerings (SPOs), under the exemptions accorded by Title I.
Ironically, while stressing the need to encourage more firms to go public, the US Congress passed Title V alongside Title I, raising the issuer registration threshold from 500 to 2,000 shareholders. Adding to this irony, US policymakers passed Title II of the Act in September 2013, creating a slew of exemptions to spur private fundraising. Title II liberalizes the sale and resale of private securities issued under Rule 506 of Regulation D (RegD), which previously could not be sold to investors through open solicitation. Instead, issuers had to rely on costly intermediaries (such as investment banks and placement advisors), to conduct such offerings and were forced to concede liquidity discounts due to limited resale prospects for private securities in secondary markets.
Findings of our empirical study
We investigate how the regulatory exemptions introduced by the JOBS Act affect equity raising choices and the type of firms accessing public and private equity markets. While recent studies have analyzed the immediate effects of Title I on the IPO market (Dambra, Field, and Gustafson 2015; Barth, Landsman, and Taylor 2017; Chaplinsky, Hanley, and Moon 2017), ours is the first study to investigate changes in equity raising preferences upon full implementation of the Act.
Our results show that the Act has raised the cost of public equity issuance and made it easier for firms of lower quality to go public rather than stay private. We also find that private markets have become a more attractive venue for fundraising following the Act. These findings are consistent with De Fontenay’s (2017, p.445) hypothesis that the ongoing efforts to revive private and public equity markets through deregulation “may instead be hastening the latter’s decline”.
We begin with a difference-in-differences (diff-in-diff) analysis of changes in aggregate equity offering activity across public and private markets following the Act. This analysis builds on the idea that firms differ in their dependence on external financing (Rajan and Zingales 1998). Firms in capital- and technologically-intensive industries tend to depend more on external funding (Chemmanur and Fulghieri 1999). As such, one would expect more firms from these industries to go public and also raise more private capital following passage of the Act compared to firms in less-dependent industries.
Consistent with this hypothesis, we find a substantial increase in IPOs among firms with more need for external financing. Similarly, private equity offers have also risen among these firms following the Act. Notably, private fundraising began surging right after Title I’s passage, even though its provisions do not affect private markets. This result may be due to Title V raising the threshold for private firms to register their securites and become fully reporting companies.
We also found significant growth of gross proceeds in private market issues only, suggesting that the Act has contributed mostly to an increase in private capital supply. Figure 1 illustrates these trends in private markets.
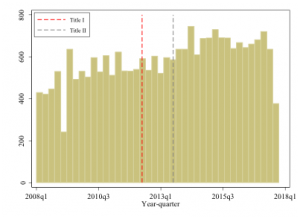
Rule 506 Form D filings during each quarter between January 1, 2008 and December 31, 2017. The data are obtained from the SEC’s EDGAR database and Capital IQ. Issuers that fulfil the following criteria are only included: (1) issuer has gross revenue below $1 billion in the last fiscal year at the time of Form D filing, (2) issuer is not classified as financial services company (SIC 6000-6999), closed-end investment fund (including REIT), holding company (SIC 6719 and 9998), special purpose acquisition company (SPAC), or conglomerate (SIC 9997), and (4) proceeds are not meant to finance acquisitions.
We extend our diff-in-diff analysis to determine the Act’s impact on secondary equity markets, where firms can opt between SPOs and unregistered private investments in public equity (PIPE)[1] to raise funds. Our results show a significant rise in the number of SPO and PIPE deals, especially post Title II, among firms that depend more on external equity. Among these, EGCs conduct 39% more SPOs and 17% more PIPEs than similar issuers that do not have EGC status (since they went public before the Act). There is also a corresponding rise in gross SPO proceeds among EGCs that require more external funding. These findings show that EGCs are taking advantage of Title I to conduct more SPOs and are utilizing Title II to conduct more PIPE offers relative to their non-EGC peers.
While the Act appears to encourage fundraising in both public and private equity markets, the question remains as to how it affects firm-level choices between the two market types. Becasue such choices are likely to be endogenous, we use a Heckman-style instrumental variables (IV) approach to understand these preferences. We find that firms are up to 48% more likely to go public as EGCs than similar pre-JOBS issuers. EGCs are also 60% more likely to pursue an SPO over a PIPE, compared to similar non-EGC issuers that went public before the Act.
Overall, these findings suggest that the Act has, in a sense, mitigated the downturn in US public equity markets (relative to the post-crisis levels between years 2008-11) by encouraging more firms to go public (see Figures 2 and 3 for an illustrated overview). Whether this increased propensity to go public reflects access to cheaper public capital or whether such costs are outweighed by the benefits of reduced disclosure and compliance accorded by Title I is a question we address. We find that although firms raise up to $3.23 million more per deal by going public than staying private, raising public equity is far more expensive in both primary and secondary markets (in terms of fees paid to intermediaries), particularly for EGCs. This shows that benefits of reduced disclosure outweigh the price firms are willing to pay to access public markets under such exemptions.

IPOs during each quarter between January 1, 2008 and December 31, 2017. The data are obtained from S-1 filings available with Capital IQ. Issuers that fulfil the following criteria are only included: (1) issuer has gross revenue below $1 billion in the last fiscal year at the time of S-1 filing, (2) issuer is based in the US, (3) issuer is not classified as financial services companies (SIC 6000-6999), closed-end investment funds (including REITs), holding companies (SIC 6719 and 9998), special purpose acquisition companies (SPAC), and conglomerates (SIC 9997), (4) the offer, if completed, is listed on the New York Stock Exchange (NYSE), NASDAQ, or American Stock Exchange (AMEX), (5) minimum offer value is $5 million, (6) the offer, if completed, has at least 30 days of price data from the effective date under share codes 10 or 11 (common shares) available on the Center for Research in Security Prices (CRSP), (7) the duration between the initial filing date and effective date (or cancellation date for withdrawn offers) does not exceed 18 months. EGC refers to emerging growth companies that went public on or after the passage of Title I of the JOBS Act on April 5, 2012, and chose the disclosure exemptions available under its provisions at the time of filing.
Since the main purpose of the Act is to improve access to public markets, we also investigate whether it reduces the costs of issuing public equity. There is no change in IPO underwriting fees, which remain clustered at 7% of offer value (possibly due to implicit collusion among underwriters; see Chen and Ritter (2000); Abrahamson et al. (2011)). However, the cost of underwriting EGC SPOs is 2.7%, or $2.56 million, higher per deal than for similar non-EGC issues. Indirect costs, measured as the underpricingof an issuer’s shares relative to the closing price on the first day, are also higher for EGC IPOs by 10.7% than similar pre-JOBS issuers. In economic terms, this translates to over $14 million in lost proceeds per IPO, meaning that EGCs forfeit much more than their non-EGC peers, possibly to compensate early investors for the disclosure exemptions they enjoy. Although Title I allows EGCs to engage confidentially with investors and to “test-the-waters” to gauge investor demand during the offer process, we find no evidence that these mechanisms are used to bring down the cost of follow-on offers. To the contrary, our analysis shows that EGCs underprice their SPO shares by at least 7.3% relative to non-EGC issuers, or about $6.9 million in forgone proceeds per deal. This implies that EGCs are either unable, or make no attempt, to reduce the costs of follow-on offers.

SPOs filed during each quarter between January 1, 2008 and December 31, 2017. The data are obtained from S-1 filings available with Capital IQ. Issuers that fulfil the following criteria are only included: (1) issuer has gross revenue below $1 billion in the last fiscal year at the time of S-1 filing, (2) issuer is based in the US, (3) issuer is not classified as financial services companies (SIC 6000-6999), closed-end investment funds (including REITs), holding companies (SIC 6719 and 9998), special purpose acquisition companies (SPAC), and conglomerates (SIC 9997), (4) the offer, if completed, is listed on the New York Stock Exchange (NYSE), NASDAQ, or American Stock Exchange (AMEX), (5) minimum offer value is $5 million, (6) the offer, if completed, has at least 30 days of price data from the effective date under share codes 10 or 11 (common shares) available on the Center for Research in Security Prices (CRSP), (7) the duration between the initial filing date and effective date (or cancellation date for withdrawn offers) does not exceed 18 months. EGC refers to emerging growth companies that went public on or after the passage of Title I of the JOBS Act on April 5, 2012, and chose the disclosure exemptions available under its provisions at the time of filing.
If going public as an EGC is so expensive, why do most firms that went public after Title I opt for such exemptions and pay high costs to access public markets? A possible explanation is that the Act encourages poor-quality firms, which would otherwise be confined to private markets due to their high information asymmetry, to go public. To test this, we compare the financial characteristics of EGCs with those of pre-JOBS issuers during the years around their respective public offers. We find that nearly 77% of EGCs would have gone bankrupt within a year had they not gone public. EGCs spend up to 89% of IPO proceeds (compared to 73% for pre-JOBS issuers) and 95% of SPO proceeds (compared to 76% for pre-JOBS issuers) within a year of the offer. However, the increased expenditure is not because EGCs invest more proceeds into the firm, but rather to repay debt and pay executives a higher compensation. These findings suggest that managers at these newly public “low-disclosure” firms may be enriching themselves at shareholders’ expense. EGCs also remain financially weaker than similar pre-JOBS issuers and are unable to use the offer proceeds to improve their finances.
Overall, we find that EGCs are generally financially unstable firms that have been able to gain access to public markets due to the Act’s provisions, provided they compensate investors for the greater risk they entail. This leads to the conclusion that the Act has incentivized firms of poorer quality to go public, resulting in the overall decline of issuer quality in US public equity markets.
Key takeaways
The JOBS Act represents the most significant deregulation of US capital markets in the past two decades. It was meant to address the “regulatory cascade” that followed the tech bubble and several corporate scandals in the early 2000s, imposing high compliance costs on firms seeking access to public markets. The JOBS Act was designed to address this problem and make US capital markets more accessible to younger and smaller firms, whose primary source of capital is equity.
We show that Title I revived public markets, albeit temporarily, and to a lesser extent than private markets. Surprisingly, private markets experienced significant growth after Title I, mainly because the Act allows private firms to raise money from up to four times as many investors as before, after which they would be subject to full disclosure, similar to that of a public company. Private markets have continued to grow unabated after Title II. Together, these findings imply that the Act has caused a separating equilibrium in US capital markets with some firms more likely to go public, and the rest opting to go private for their funding needs. Analysis of issuance costs confirms the existence of such a separating equilibrium among firms raising equity post JOBS.
EGCs seem to trade-off reduced disclosure and compliance against the costs paid to issue public equity. This does not mean that concerns over proprietary information leakage prevent EGCs from indulging in full disclosure. Instead, the Act lowers the threshold required to go public, and possibly incentivizes financially unstable firms that otherwise face difficulties accessing capital markets.
A vast majority of EGCs spend their proceeds within a year of the offer mainly to repay debt and pay management, and not to invest in the firm. In addition, EGCs frequently rely on public markets to avoid bankruptcy. The fact that the Act has made it easier for firms of poorer quality to go public suggests a partial lemons situation that is detrimental to other participants in US public markets.
Our study adds to the ongoing policy debate on the growing regulatory burden that is making it difficult for small, emerging firms to raise capital. The JOBS Act was meant to revive economic activity that had stalled in the aftermath of the 2008 financial crisis by improving access to capital, especially for smaller firms. Our results show the Act to be ineffective at reviving public markets despite increased activity, mainly due to rising issuance costs and the entry of poorer quality firms into public markets since its passage. We find that the Act has instead contributed to the growing attractiveness of private markets.
Recent news reports suggest that the lawmakers are contemplating a “JOBS Act 3.0” that would extend certain provisions of the original Act (see Crabb 2018). Our study raises concerns over such proposals and questions whether easing regulatory constraints is the best available policy mechanism to promote capital formation. More research is required to determine how the regulatory framework governing US capital markets can be improved to address the capital needs of firms.
References
Abrahamson, M., T. Jenkinson, and H. Jones. 2011. Why don’t US issuers demand European fees for IPOs? The Journal of Finance 66: 2055-82.
Barth, M. E., W. R. Landsman, and D. J. Taylor. 2017. The JOBS Act and information uncertainty in IPO firms. The Accounting Review 92: 25-47.
Chaplinsky, S., K. W. Hanley, and S. K. Moon. 2017. The JOBS Act and the costs of going public. Journal of Accounting Research 55: 795-836.
Chemmanur, T. J., and P. Fulghieri. 1999. A theory of the going-public decision. The Review of Financial Studies 12: 249-79.
Chen, H. C., and J. R. Ritter. 2000. The seven percent solution. The Journal of Finance 55: 1105-31.
Crabb, J. 2018. JOBS Act 3.0 bundle not the answer for SME listings. International Financial Law Review.
Dambra, M., L. C. Field, and M. T. Gustafson. 2015. The JOBS Act and IPO volume: Evidence that disclosure costs affect the IPO decision. Journal of Financial Economics 116: 121-43.
De Fontenay, E. 2017. The Deregulation of Private Capital and the Decline of the Public Company. Hastings LJ 68: 445.
Rajan, R. G., and L. Zingales. 1998. Financial Dependence and Growth. American Economic Review 559-86.
[1]We only consider PIPE offers issued under Rule 506 of Regulation D as this constitutes the biggest segment among private equity offers by public firms.