As an anthropologist, it feels easy to write about cities. Some of us spend a lot of time in them, working with others who live and breathe urban space daily. This gives us a richness of experience, which we then try to use to say something about life in the city itself. But teaching others about cities is a different matter. What one writes about a given city does not necessarily have any inherent pedagogical value – other processes must intervene before something become ‘teachable’.
I joined the VCL with this concern for ‘teaching the city’, as it’s something I expect to do myself one day. Other questions quickly emerged: How can we teach the city visually? Though anthropologists do often incorporate visual material, they are still a very text reliant lot. I was interested in how we could use the ‘visual’ as an entry point in a way that remained faithful to the ethnographic experience of the city that anthropology holds so dear.
My last question surfaced during Team Tokyo’s initial discussions. Anchored in the 1964 Olympics, we leaned into the use of historical visuals to explore Tokyo’s changes around that time. But, stealing from Marx, all that is Tokyo melts into air. My research on Japan’s postwar public housing (danchi) has taught me that cities like Tokyo present us with a profound problem because they constantly change. Though at least 400 years old, modern Tokyo’s architectural record is astoundingly thin. This historical poverty begets a visual poverty: you can’t really ‘see’ the historical layers of Tokyo because so much of it is gone. How do we teach about something that is no longer there?
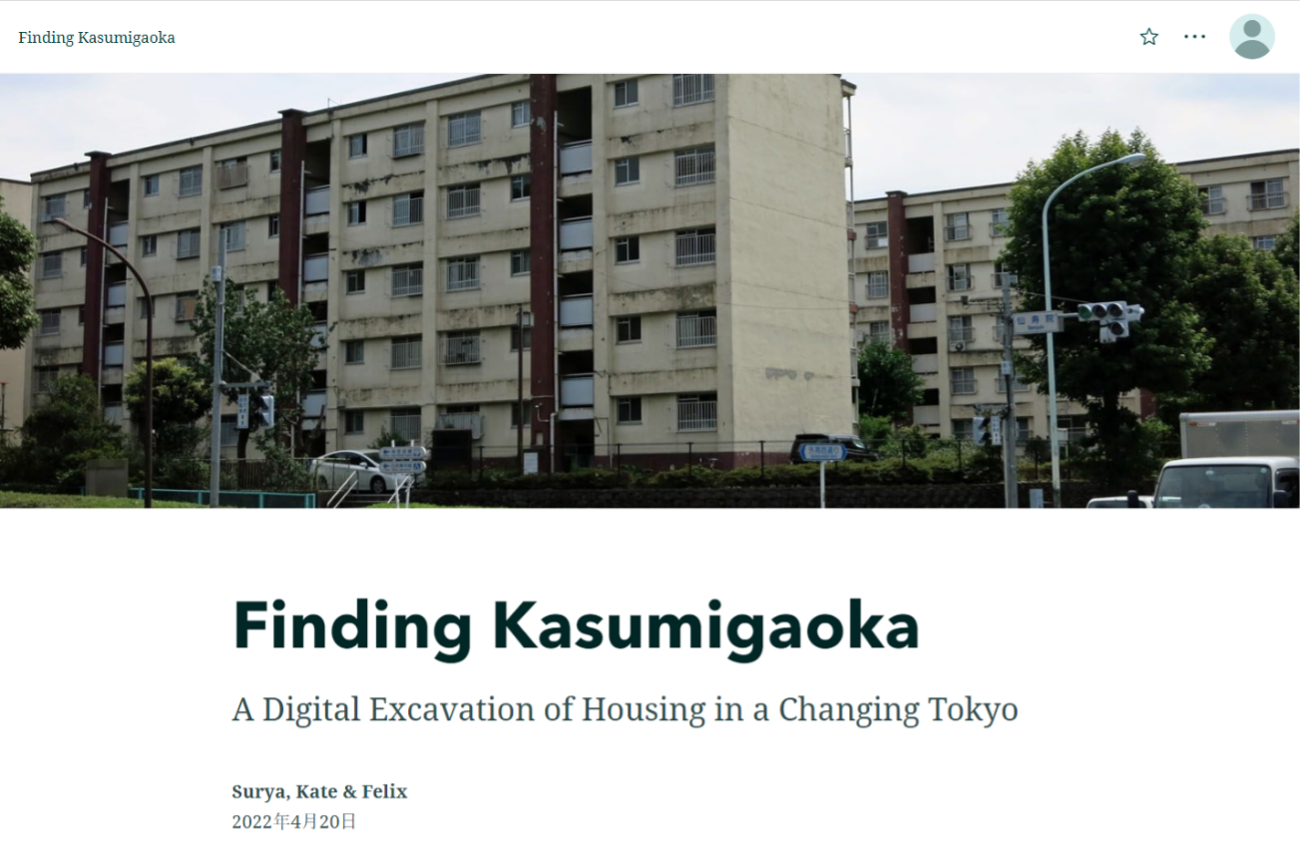
With all this in mind, the Housing sub-group’s project began with Tokyo’s 2020 Olympics. Several news articles told remarkable stories of now-elderly residents who had been evicted from their homes for Olympics-related redevelopment not once, but twice – before both the 1964 games and the 2020 games. One main site emerged: Kasumigaoka Apartments, a public housing project constructed during the pre-1964 wave of urban renewal that was then demolished during a similar wave before 2020.

Kasumigaoka Apartments, c. 2015
(Source: http://sanpototabi.blog.jp/archives/1047891515.html)
Kasumigaoka became our focus. Thankfully, there was a wealth of online textual information that helped us trace its history. But visual materials were essential here too: working with aerial photography of the Yoyogi area from the Geospatial Information Authority of Japan, we could track the changes the Kasumigaoka site had undergone since the 1930s. Things mentioned in interviews with former residents – Kasumigaoka’s construction in the early 1960s, the nagaya tenements that occupied the site earlier – suddenly had visual form.

1948 aerial photograph of Yoyogi area, showing nagaya tenements (center-right)
(Source: Geospatial Information Authority of Japan)
Armed with text and image, our group decided to digitally excavate Kasumigaoka. We had two immediate aims: tracking the development of the site to see how public housing typologies changed from the 1940s to the 1960s; and tracing the life paths of former residents to see how people moved through Tokyo, Japan, and the world before settling in Kasumigaoka. This historical ethnography would, we hoped, tell us something interesting about historical change and life experiences in Tokyo.
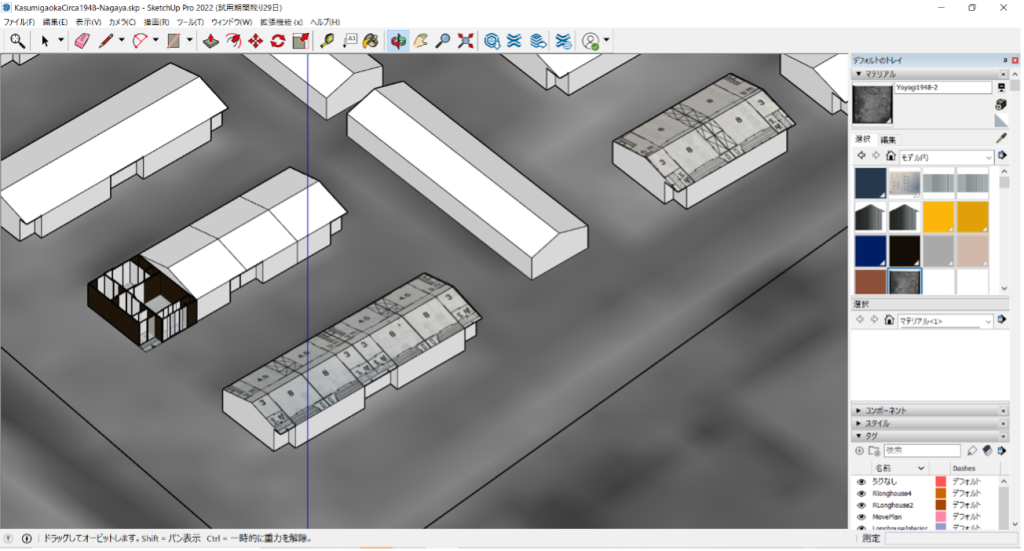
Relying on a combination of aerial photography to reference site layouts and contemporaneous floorplans, we used SketchUp to develop 3D models of the 1948-1963 tenements and the 1964-2016 Kasumigaoka complex. We also compiled a list of all the places each interviewed resident had lived in and the accompanying dates to plot spatially later. We integrated these elements via StoryMaps, bringing together contemporary photographs of Kasumigaoka, aerial photography of the changing site, the 3D models, and dynamic maps that tracked two residents’ paths through the city and the world. This combination of different sources helped us tell the story of Kasumigaoka – a microcosm of urban change in Tokyo.


3D SketchUp model of nagaya complex, based on 1948 aerial photograph and contemporary floor plans
Learning to use SketchUp and StoryMaps was a major takeaway from this process. But beyond mere technical pickups, this experience showed me the importance of digital visualization as a research and pedagogical tool. The hands-on process of building site models gave me insight into the materiality of the site itself in ways that escape traditional research methods. And these models, in concert with photography and maps, let us introduce others to a site that no longer existed in an immediate and interactive way. Anthropologists like myself – always interested in the ever-fleeting now – can use these tools to creatively engage with (and engage others with) what is no longer there. Visualizing the city through the creative use of technology thus bridges several gaps: the city’s past and present, urban history and urban anthropology, the virtual and the material, and pedagogy and research.
Selections from the final Kasumigaoka StoryMap


Leave a Reply