


The low-carbon transition is likely to induce drastic changes in our economies that will affect how we produce and consume. Changes in the “real” economy will almost certainly impact the financial structures built upon it, including the balance sheets of states, households, and corporations. The assets that compose these balance sheets may dramatically fall in value – a phenomenon known as asset stranding.
While many processes contribute to greenhouse gas emissions, the most significant involve the combustion of fossil fuels, so transition-related disruptions are likely to be substantial for sectors directly employing fossil fuels in their productive processes. Yet, the impacts are likely to go beyond those sectors, as they provide indispensable intermediate inputs to more downstream sectors producing consumption goods and services. Through production network linkages, the defossilization process could substantially disrupt the entire economic system, in turn driving financial instability and, potentially, financial crises – a capital stranding cascade.
Our novel contribution to the understanding of the low-carbon transition is to estimate the potential for a decline in fossil fuel inputs to strand physical productive assets throughout the economy – that is, the machines and infrastructures that rely, either directly or indirectly, on fossil fuels. Stranding of physical capital assets can take three main forms: (i)premature decommissioning of assets; (ii) reduced utilization of assets; and (iii) costs linked to the retrofitting of assets. In our analysis, we identify risk of stranding with a decline in capital utilization.
Our analysis provides a systemic perspective on the supply-side risk of physical capital stranding. It applies input–output (IO) analysis to a multi-regional production network database, the World Input-Output Database (WIOD). WIOD provides data for 43 individual countries for the year 2014. Most of the countries in WIOD have high per capita income, but it also includes several relevant emerging economies. WIOD allows for disaggregated coverage of around 48% of global oil production, 61% of natural gas production, 90% of coal production; and 69% of extraction-based CO2emissions. IO tables record the economic relations between sectors of a given country and between sectors of different countries. For instance, they tell us how much the food industry in the United Kingdom uses production from the agricultural sector in the US.
Marginal stranding multipliers
To assess stranding risk, we combine IO data of intermediate consumption flows between sectors with sectoral capital stock data to compute cross-sectoral and cross-boundary “marginal stranding multipliers.” We calculate these multipliers at the level of all the WIOD countries taken together and for each country individually. They tell us how much of the capital stock of a particular sector in a particular country will become idle if we remove one unit ($1) of labor or capital entering the fossil fuel sector in either the same country or another country, including both direct effects stemming directly from the fossil fuel sector and indirect effects through other sectors.
The marginal stranding multipliers thus allow us to quantify the quantity of capital that could become stranded in, say, the chemistry industry of the UK if $1 of labor and capital were removed from the US fossil fuel sector. The country-specific multipliers provide insight into which country could pose the highest stranding risk for other countries and which countries are the most exposed. We estimate total stranding potential due to both the internal stranding potential, which is stranded capital of the sector itself, and the external stranding potential, which is stranded capital in other sectors.
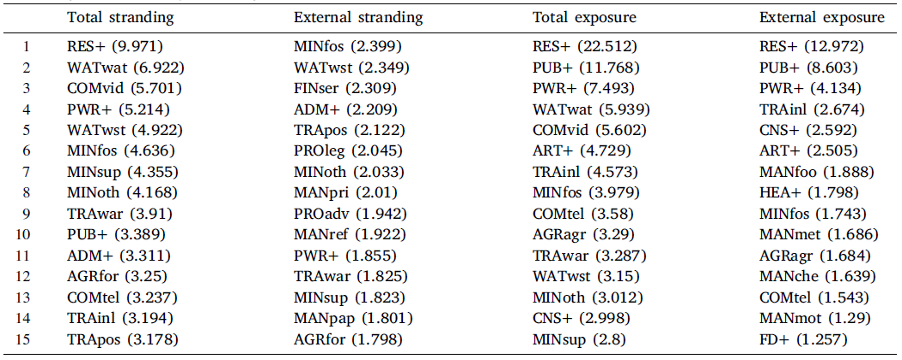
Table 1 ranks sectors according to their: (i) total stranding multiplier from a drop in the fossil fuel sector; (ii) external stranding multiplier; (iii) total stranding exposure from a generalized drop-in activity across all sectors; and (iv) external exposure to stranding from other sectors. Starting from global results, we start by noticing that, among all global productive sectors, the fossil fuel sector (MINfos) is the productive sector with the sixth strongest total stranding potential. In the first column, fossil fuel mining exhibits a total stranding multiplier of 4.636. This means that a reduction in labor and capital of $1 in the global fossil fuel sector puts $4.636 of capital at risk of being stranded in the whole economic system. However, most of the stranding risk originating in a sector concerns the sector itself. Looking to the second column, after removing the contribution from internal stranding, the fossil fuel sector appears as the sector capable of creating the largest stranding effect on the rest of the economic system, with an external multiplier of 2.399. This means that amongst all global sectors, the fossil fuel sector is the cause of the highest risk of capital stranding in other sectors, followed by the waste (WATwst) and financial services (FINser) sectors.
The two final columns provide estimates of the total and external exposure of a sector to a scenario with a marginal shock taking place in all sectors (e.g., a generalized drop-in economic activity). Due to their high capital intensity and their large use of intermediate inputs, the real estate (RES+) and public administration (PUB+) sectors are by far the most exposed to the shock. Sectoral risks from a low-carbon transition are different from those from a general recession.
Table 1. Stranding multipliers and exposure to stranding for the top 15 sectors.
Stranding cascades
Figure 1 illustrates the stranding cascade originating in the global fossil fuel sector, with the fossil fuel mining sector at the top of the pyramid. The numerical value inside the fossil fuel mining node represents the stranding strength of the initial marginal shock of $1:$2.099 worth of capital immediately stranded in the fossil fuel sector due to the $1 shock in labor and capital entering it. The next layer shows the sectors most affected by the lack of intermediate fossil fuel inputs. The numerical values on the branches represent the strength of each stranding relation, while the values inside the nodes reflect the value of the total stranding taking place in the sector in a specific round, including both direct and indirect effects. The most affected sectors in the first round are the power (PWR+), coke and refined petroleum products (MANref), and basic metals (MANmet) sector. This makes sense – the power and refinery industries require fossil fuels as direct inputs in their production, while the metal industry uses fossil fuels to generate heat (e.g., in blast furnaces).
The further layers of the network show the sectors most affected by the stranding taking place in the previous layer. Second-order stranding links include those connecting the refinery sector with the land transport services sector (TRAinl) – which also includes transport via pipelines – and the PUB+. They also include the link between the power sector back to the fossil mining sector. The stranding in basic metals cascades down to industries using metallic products, but its strength is less pronounced, showing a weakened influence. The final layer shows how broadly the initial impact can be once it cascades through the economy. The strength of any single stranding link is lower than in upper layers but, due to the multiple active stranding links, the overall stranding in these rounds is still relevant, especially in the power (0.056) and real estate (0.055) sectors.

Figure 1. Global stranding cascade originating from the global fossil fuel sector.
National rankings
We now dig a bit deeper with estimates of cross-country effects. But first, it is worth remembering that the shock we investigate – a marginal reduction of labor and capital employed in the domestic production of fossil fuels – is applied equally to all countries, irrespective of their absolute amounts of fossil fuel extraction. Hence, the stranding results do not depend on the relevance of the country as a producer or exporter of fossil fuels. Rather, they depend on (i) how concentrated are monetary outflows from the fossil fuel industry towards specific sectors, and (ii) how capital intensive are the sectors receiving fossil fuel products. For example, a marginal shock in a country where all fossil fuel products flow to a single sector with high capital intensity will cause large capital stranding effects, even if fossil fuel extraction levels are very low.
Figure 2 shows the top 10 countries by their external stranding multiplier (the labels on the left), with the countries they most strongly affect. As with total stranding rankings, low levels of fossil fuel extraction do not shape the results. France, a marginal producer of fossil fuels, is at the top of the ranking, mainly due to the very high proportion of production being exported (96%) and the high capital intensity of its major importing sectors (especially Slovakian power and refining sectors). Australia is in second place, mainly due to the strong stranding effect created by the Japanese power sector and, to a lesser extent, the power sectors of China, South Korea, and Taiwan.
Slovakia ranks third, predominantly due to its high stranding effects on the Czech economy, which also creates relevant stranding links back to Slovakia (in seventh place). These results suggest continued strong integration between the two countries’ productive systems after their separation in 1993. It should also be noted how the USA and China – the two largest fossil fuel producers in our sample – are at the bottom of the external stranding ranking. While this might seem counter-intuitive, it is easily explained by two facts. First, the large majority of their fossil fuel production (92.5% for USA and 99.5% for China) is consumed internally; therefore, most of the stranding effects are felt internally. Indeed, both countries rank much higher when domestic stranding is included (15th position for USA; 22nd for China). Second, they export fossil fuels to many countries whose sectors have relatively low capital intensity.

Figure 2. Top 10 countries for external fossil stranding multipliers. Framed values on the right represent the external multiplier of the given country (stranding effect on all other countries)
Reversing the logic and looking at the most exposed countries instead, the picture changes. Figure 3 ranks the top 10 countries according to their exposure to fossil stranding coming from abroad. Total exposure represents the monetary value becoming stranded in the country in the scenario of a generalized drop of external fossil fuel extraction – that is, a marginal shock assumed for all of the WIOD countries, except for the one we are analyzing. We then disaggregate the total exposure by the source of stranding. In this ranking, the US is by far the most exposed country ($6.76 of capital are exposed to stranding risk in the case of a generalized decline of $1 of labor and capital entering all foreign fossil fuel sectors), with Canada (1.75) and Mexico (0.98) being, by far, the most relevant origins of these stranding risks. China is the second most exposed country (with a coefficient of 4.69), where in contrast to the US, the originating countries are more diversified. Japan is in third place, with a total exposure coefficient of 3.99. The sources of risk for Japan originate predominantly in Australia (1.08) and Spain (0.66).

Figure 3. Top 10 countries for stranding exposure. Framed values on the right represent the exposure of the given country (stranding effect from all other countries)
International transmission of stranding risk
Deeper insight into how individual countries are exposed to fossil fuel stranding links is provided by a study of the network origins and transmission channels. As an illustration, Figure 4 displays results for the USA showing the exposure networks with the largest direct and indirect stranding links that affect the most exposed sectors. For the US, the most exposed sectors are PUB+, PWR+, and RES+. We place them at the bottom of the network and add their total external exposure values to the node labels. We then look for their strongest incoming one-step, two-step, and three-step fossil fuel stranding links to understand where their exposure originates and how it reaches them through the production network. While the number of steps is arbitrary, most of the dominant stranding cascades are expected to take place within the first few steps.
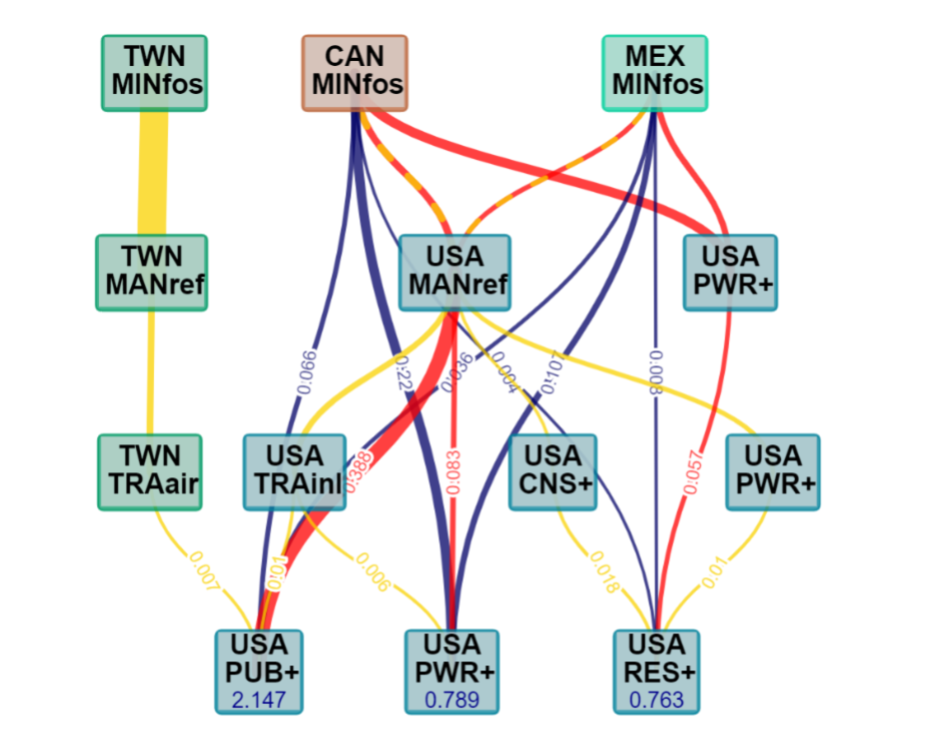
Figure 4. Main fossil exposure links for the USA. Direct (one-step) links are blue, two-step links red and three-step links yellow. Edge values represent the stranding effect of a cascade on the exposed sectors on the bottom. Values inside the bottom nodes reflect their total external exposure (to all foreign fossil industries).
As already observed on figure 2, US sectors are heavily exposed to the Canadian and Mexican fossil fuel (MINfos) sectors. Significant direct stranding links exist between them and all of the US sectors at the bottom of the network, with the one linking Canada’s fossil fuel sector and the US PWR+ industry being the strongest. Indeed, shocks originating in Canada – the main fossil exporter in our sample – affect the US economy more than the Canadian economy itself.
Several important two-step stranding links exist, with the most relevant connecting the Canadian and Mexican fossil sector to the US MANref, and then from there to PUB+ and the power sector. Three-step stranding chains follow similar channels, with US refining affecting TRAinl, construction (CNS+) and power industries, which in turn affect the sectors of interest at the bottom of the diagram.
A further three-step stranding cascade originates in the Taiwan fossil fuel industry, passing through the Taiwanese refining and air transport (TRAair) industry, and finally affecting the US PUB+ sector. Due to the very limited production volume of the Taiwanese fossil fuel industry, this cascade is of little practical relevance, but it illustrates the point made earlier: that sectors with a concentrated use structure typically have high marginal stranding potential. This particular cascade draws its strength from the substantial linkage between Taiwan’s fossil fuel and refining industries. This strong impulse then trickles through to the US PUB+ sector via Taiwan’s air transport industry, which serves as a major trans-pacific cargo service provider and is used by the US PUB+ sector to import manufactured goods.
Preparing for the low-carbon transition
The systemic risks of transitioning to a low-carbon society under the current technological conditions are complex and still largely unknown. To help fill the research gap, we developed a methodology to estimate the monetary value of capital stocks at risk of becoming stranded as a consequence of a marginal loss of labor and capital employed in the fossil sector, taking into consideration the network of economic inter-dependencies. The methodology provides (i) marginal stranding multipliers of countries’ fossil sectors, and (ii) a measure of the exposure of national economic systems to the risk of capital stranding coming from fossil sectors abroad. We found several interesting results.
First, and unsurprisingly, fossil industries exhibit the strongest potential to create capital stranding in other sectors. Second, however, while some sectors are directly exposed to the fossil fuel shock, such as energy and manufacturing, other sectors are mainly affected by indirect effects. Indeed, service sectors like real estate and public administration rank amongst the most affected ones by global fossil stranding. This supports the intuition that the whole global productive system would be affected by the decarbonization process, and not only heavy industry sectors using fossil fuels as direct inputs.
Third, when countries are ranked according to their impact on other countries – the external stranding potential – some surprising countries appear at the top of the ranking: France, Australia, and Slovakia. The US and Italy are at the bottom. These results are explained by the proportion of the exported fossil production of the top countries and the capital intensity of the sectors importing this production. Countries whose fossil fuel production is largely consumed onshore, as in the USA and China, appear the bottom of the external stranding ranking. Our results therefore show, counter-intuitively, that a country’s marginal stranding power does not correlate automatically with its importance in global fossil fuels production. Conversely, the capital stocks of the USA, China, and Japan are the most exposed to the risk of stranding due to a generalized drop in foreign fossil production.
Our analysis is intended for practical use. It offers meaningful results with important implications for policymakers, particularly central banks, financial supervisors, and other institutions interested in mitigating climate-related financial risks. In the larger picture, we have shown that a systemic view on capital stranding through the representation of production networks provides insight. Further refinements and elaborations can contribute to future and more sophisticated and comprehensive risk assessment methods as we prepare for the urgently needed low-carbon transition.
Louison Cahen-Fourot is an assistant professor at Roskilde University, Denmark
Emanuele Campiglio is an Associate Professor at the University of Bologna, Italy
Antoine Godin is the head of the GEMMES macro-modelling unit at the Agence Française de Développement, France
Eric Kemp-Benedict is the Equitable Transitions Program Director at Stockholm Environment Institute, USA
Stefan Trsek is a Student at WU Vienna University of Economics and Business, Austria
This post is adapted from their paper, “Capital stranding cascades: The impact of decarbonisation on productive asset utilisation” available on Science Direct.
The views expressed in this post are those of the authors and do not represent the views of the Global Financial Markets Center or Duke Law.