
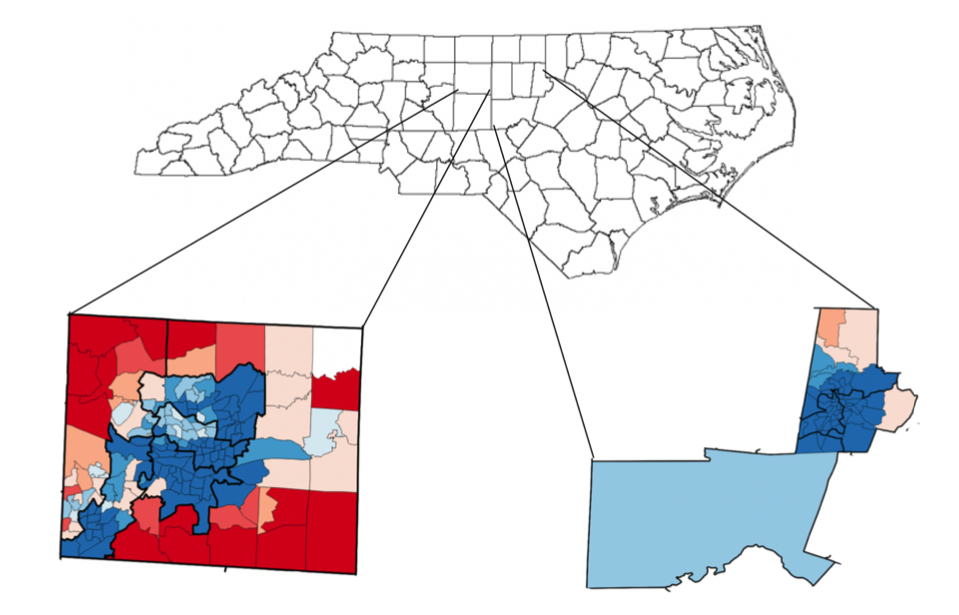
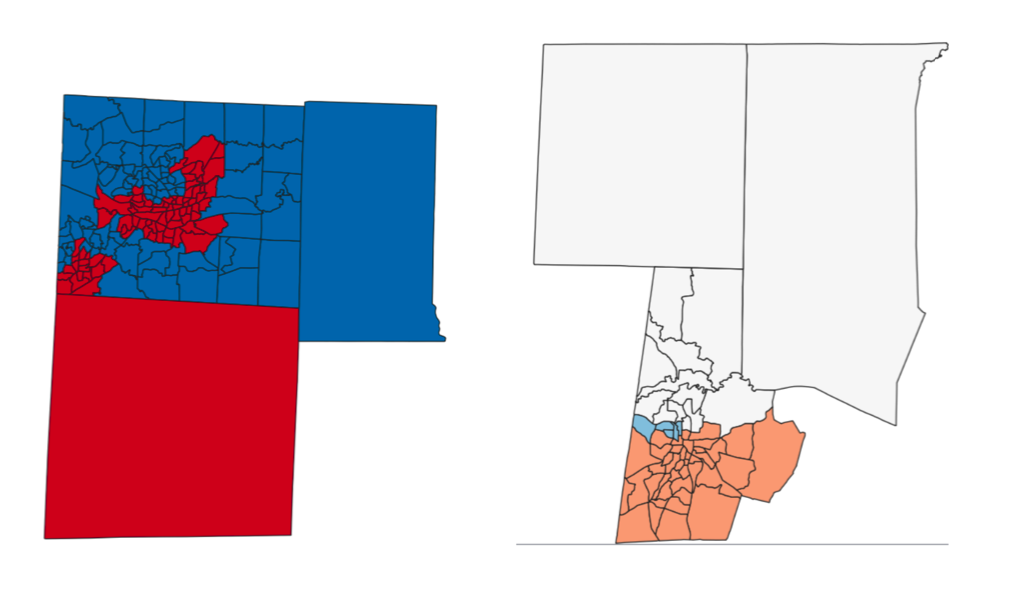
The two maps above represent the 6 state house districts contained within Guilford County (left), and the 4 state house districts contained within Durham and Chatham counties. The colors in each county represent the Democratic vote fraction of every precinct within the county for the 2016 Gubernatorial election. If we examine the districts in Guilford county, we see a sharp divide between red and blue. The central southern blue “boot” seems to have been perfectly removed from the surrounding sea of red, and the south-western district seems to diagonally carve out the the blue votes, placing them with more northern blue votes, rather than placing them with the nearby red precincts in the south-west corner.
It is reasonable to ask if this is an instance of packing the Democratic (blue) voters into a select few districts to increase the influence of the Republican (red) voters in the outer rings. Ignoring, for a moment, that these districts may have been built to preserve cities, we ask whether such sharp divisions are typical within an ensemble of plans (spoiler: Preserving cities may be part of it, but the “boot” is not part of a city, and the south-western district splits the city of High Point down the middle.) In short, we want to know
In gerrymandered plans, do the lines sharply separate the vote?
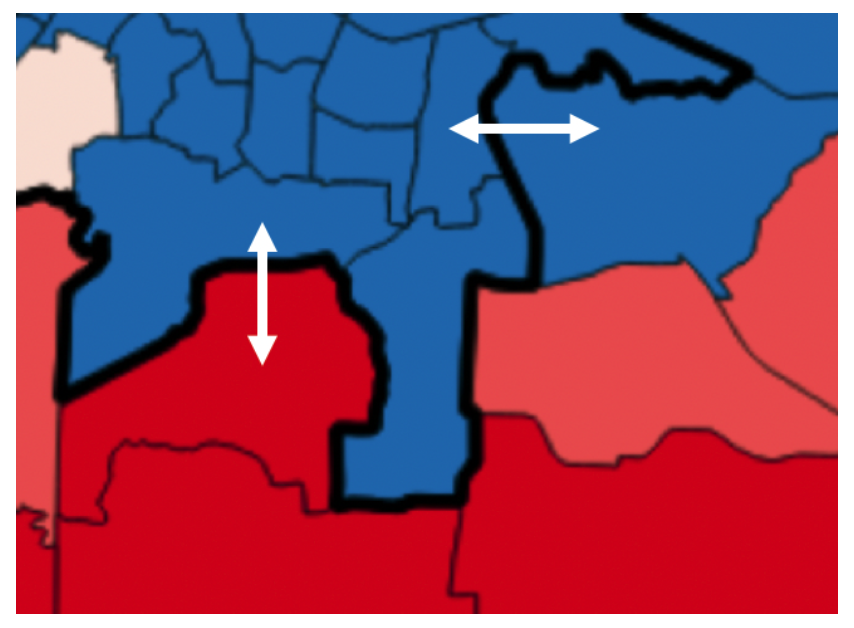
To begin to answer this question we define a “gradient” as the difference in vote percentages between two precincts. Looking at Figure 2, we see an example gradient in Guilford County. The deepness of the coloration (blue = Democrat, red = Republican) determines how strongly a precinct votes Democrat or Republican. From Figure 2, we note that precincts with starker color contrasts represent steeper gradients, as differences in voting are greater.
Employing the gradient as our metric, we conducted a three-pronged analysis into the gradients of precincts and districts:
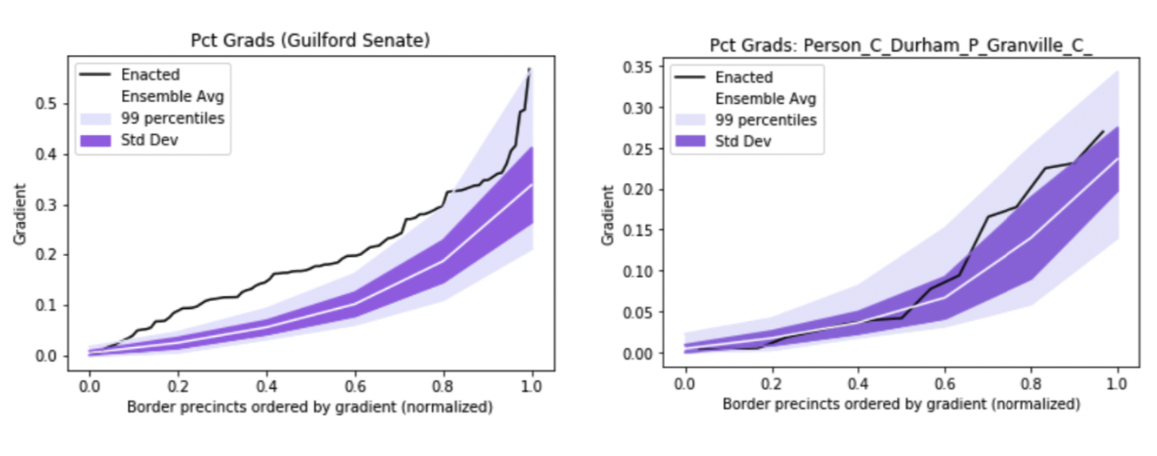
- Sum up all the gradients from every pair of precincts on the borders and compare the average of our ensemble plans to the enacted plan.
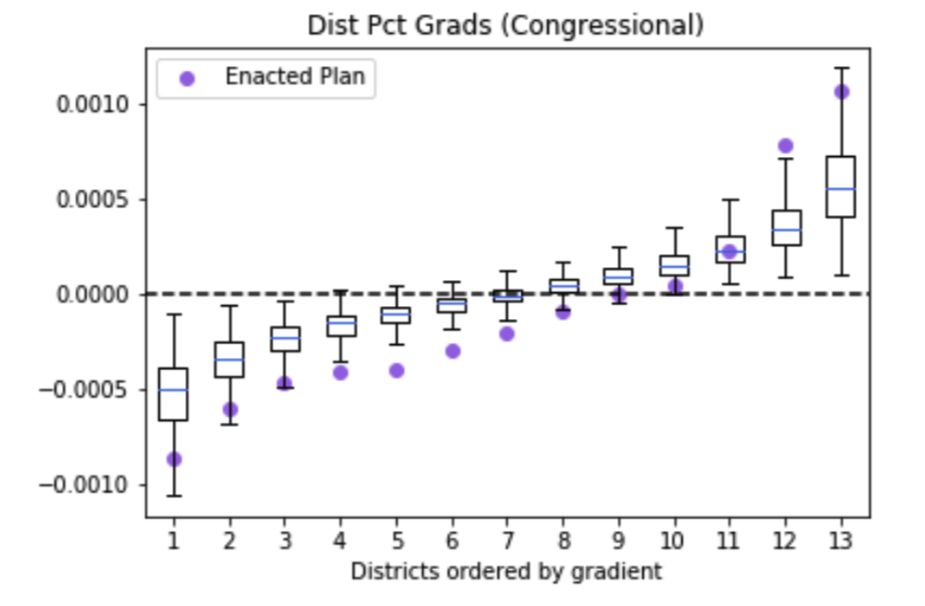
Looking at Figure 3, we note that the black line represents the enacted plan’s precincts ordered by gradient. The white line and surrounding purple ranges represent the distribution of gradients for the ensemble gradients. Reviewing Guilford in Figure 3, we note that the steepness of each gradient of the enacted map is outside a standard deviation – many are outside the 99th percentile. This reveals that the enacted map’s gradients are extremely steep in comparison. However, this atypical steepness is not observed in Chatham-Durham. Gradient precincts often directly line up with the ensemble average, and almost all precincts lie within one standard deviation of our ensemble.

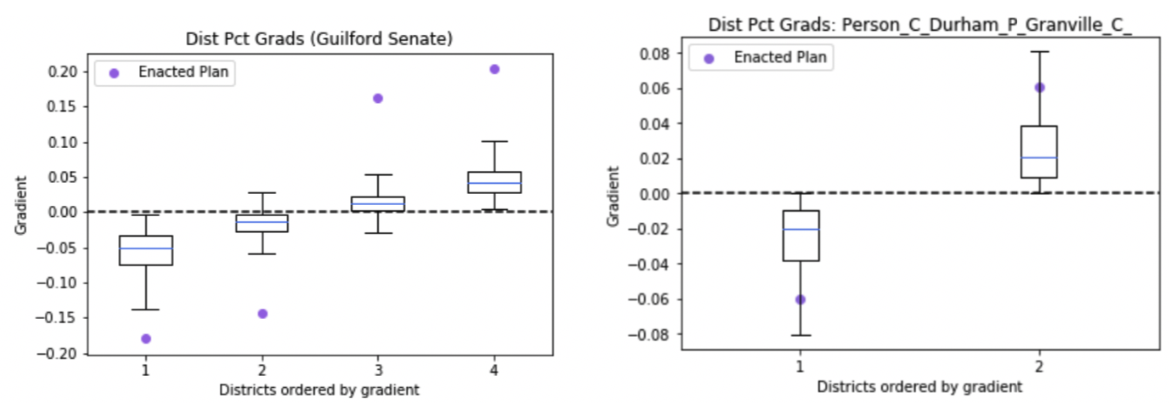
- Sum up all the gradients by district and compare the average of our ensemble plans to the enacted plan.
Looking at Figure 4, we ultimately found that the Guilford county cluster appears to have atypically steep gradients in all but one of its districts. Districts with generally low gradients in the ensemble have an even lower gradient in the enacted plan, and similar trends occur for districts with generally high districts. By contrast, the gradients of each district in the enacted plan for Chatham-Durham fall within the range of our ensemble’s corresponding distribution.

- Average the gradient for each individual precinct across the ensemble plans, then average precincts by district and compare our ensemble to the enacted plan.
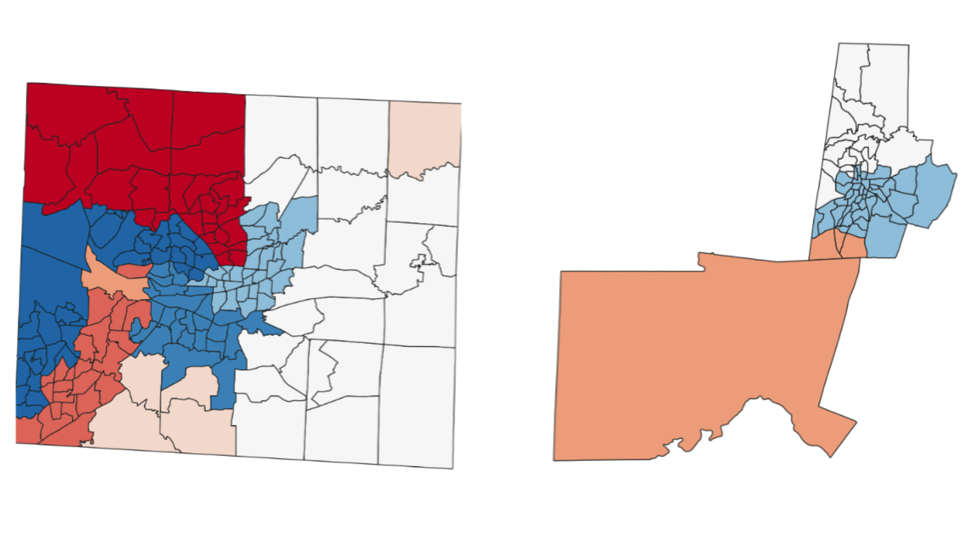
The following graphs in Figure 5 showcase the difference in gradients between the enacted plan and average ensemble plan. Overall, lighter colors represent gradients more typical with the ensemble, whereas deeper shades of red and blue represent more atypical gradients relative to the ensemble. Looking at the Guilford House county cluster, we observe that there are generally deeper precinct colorations in comparison to the Chatham-Durham House county cluster. Because deeper shades of reds and blues correspond with greater differences between the enacted plan and average ensemble plan, we note that Guilford overall has steep gradients.
Comparing Guilford with Chatham-Durham, we found that the enacted plan’s gradients significantly exceeded typical gradients seen in the ensemble in Guilford County. By comparison, Chatham-Durham enacted gradients fit well within the range of our ensemble in our analysis. These results also stayed true across elections in the North Carolina State Senate and Congress (see Figures 6 – 9). It is remarkable that even as the size of a district grows, relative to the size of precincts, the gradient appears to continue to be relevant.
Our case study analysis reveals that steep gradients may indicate significant segregation of political parties and voting patterns across borders. Whether this trend correlates with gerrymandering requires further analysis, the gradient metric deserves to be investigated further. For instance, what instances of gerrymandered plans have shallower gradients?
We save the answers to such questions for future investigation, but note that the precision of where one draws the line may prove a promising measure to identify gerrymanders.
Jacob Rubin
This work was done as part of the 2018-2019 Bass Connections team on Gerrymandering. It was done in collaboration with Rahul Ramesh and Haley Sink.