My name is Rebecca Schmitt and I am a 4+1 student at Duke University. I am currently in my undergraduate senior spring, and I am taking graduate classes now as a part of the MS in Mechanical Engineering program. I have worked on air quality research at Duke as well as Duke Kunshan University. For this class, I have been working towards a quadrupedal robot capable of air-quality monitoring.
Since studying biodiversity and biogeography in Australia my first-year summer at Duke, I developed an appreciation for biomimetics. I was amazed at how practical so many things in nature could be. Biomimetics is essentially utilizing design concepts developed by the natural world and applying these properties to man-made technology, processes, and products.
One branch of biomimetics is terradynamics, in which biology, robotics, and physics are synthesized to create machines capable of land locomotion.The benefits of a moving robot capable of traversing complex terrain are endless: there are search & rescue applications, defense and public safety, home service and health care, both of which would enable people, and environmental monitoring.
I am most interested in environmental monitoring and I believe that air sensors would be beneficial for the following reasons:
Poor Global Air Quality
Following global worries of worsening air quality in highly industrial cities, companies have even developed specialized facemasks that aim to protect users from air pollution. Upon viewing the map below, it becomes apparent that these concerns are quite valid and that this is one instance of public health precautionary measures. The map below uses levels of ozone and particulate matter concentrations to generate an Air Quality Index (AQI) for a given area.
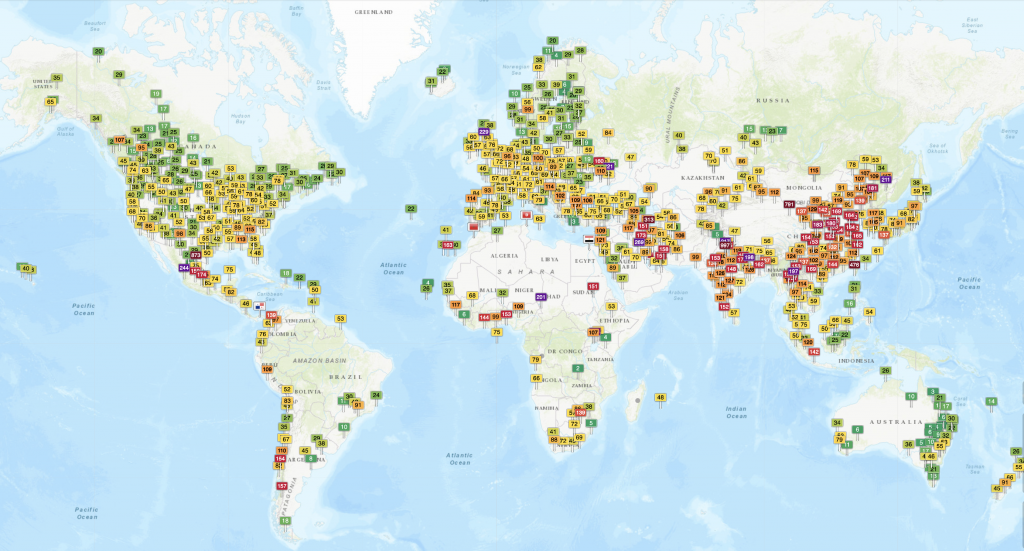
One of the most reliable indicators of air quality is particulate matter concentration; higher particulate matter creates a lower quality of air and vice versa. Particulate matter are tiny liquid or solid droplets in the atmosphere that originate from vehicular exhausts and various forms of combustion; these particles can then also chemically react with other components in the air (NYS Department of Health, 2016). When particulate matter is about 2.5 microns in diameter, it is referred to as either fine particulate matter or PM2.5. Though high levels of particulate matter as a whole is concerning for an environment’s air, PM2.5 poses an even deeper threat. Increased PM2.5 has adverse effects for public health as these tiny particles can become lodged in the lungs and aggravate respiratory health (NYS Department of Health, 2016). Lung irritation, chronic bronchitis, increased asthmatic issues, and other lung inflammatory responses are linked to high PM2.5 levels (NYS Department of Health, 2016). Particularly vulnerable populations are children, pregnant women, the elderly, and joggers (due to increased breathing).
With such critical effects, the Environmental Protection Agency (EPA) and the World Health Organization (WHO) have standardized safe levels of PM2.5 exposure for both long-term and short-term. The EPA’s current standards are 35g/m3 for a 24-hour period and 12g/m3for a yearly average (NYS Department of Health 2016). The WHO’s standards are a bit more strict, with 25g/m3for a 24-hour period and 10g/m3 for a yearly average (WHO, 2018). In 2016, 91% of the world’s population lived in conditions that did not meet WHO guidelines (WHO, 2018). Highest PM2.5 concentrations are seen in major industrial cities. With statistics like this, air quality surveillance becomes a public safety measure.
Lack of Monitoring
As seen in the map above, there are many areas in which researchers have limited data, with sparsely spread sensors. Some places even have no data at all. Of course, for some regions, there are geographical barriers such as the Australian Outback, the Sahara Desert, or mountain ranges. Other areas are remote. However, there are places in South America and Africa that are both well-populated and have no notable geographical hindrances, but still lack the air-quality monitoring support. Likely due to economic barriers, certain countries are not able to survey their air-quality at all. Hence, a low-cost sensor would be the most ideal for these places.
Even in places where there are plenty of sensors to nationally track the air quality, the average citizen does not have the ability to measure air pollution in their direct vicinity. These PM2.5 and ozone concentrations may vary, but the AQI gives a good approximation for a region. Even so, someone may want to know where in their home or office building the air quality is the worst, so that they may optimize placement of air filtration systems. In my previous coursework, I was involved with researching how air quality varies on two different campuses, Duke and DKU.


The air quality in Kunshan, China is widely perceived as poor, yet quantitative data is limited. In March 2018, Duke University undergraduates enrolled in CEE 292: International Applications of Environmental Field Methods traveled to Duke Kunshan University (DKU) to address this knowledge gap. The team utilized PM2.5 sensors in both Kunshan and Durham to compare indoor and outdoor PM2.5 concentrations and the effects of these levels on human health based on the biomarker of exhaled nitric oxide.

The experiment found that DKU’s air quality had PM2.5 concentrations about ten times higher than Duke’s in both indoor and outdoor locations. I’m sure that administration was aware of the region’s poor air quality, but these numbers gave them a more individualized record. Even for a private university, without the access to this type of technology, measuring the air pollution of a certain area is nearly impossible and one can only rely on the sensors already installed elsewhere for data.
Environmental Justice
Already briefly touched upon earlier but making this type of technology accessible and affordable would close gaps in knowledge. Besides the lack of environmental monitoring in certain countries, within specific nations it is often that only the most well-resourced areas will have sensors tracking the air quality. Typically, the more industrialized areas tend to have lower air quality; within these cities, it is often that marginalized people are more likely to suffer from prolonged exposure. PM2.5 is particularly harmful and has shown to cause asthma to those with prolonged exposure. It is an act of environmental justice to better equip vulnerable populations with the tools to keep track of and research their own living conditions. With this information, self-advocation and community rallying is much easier as there is data to support the need for policy-change.
Having a movable air sensor would be highly beneficial. There is potential to create mappings of gas concentrations and even monitor areas that were too difficult/too expensive before. If a particular person is curious about the air quality in multiple areas, but cannot spend resources on multiple sensors, a moving air sensor would give them the ability to monitor many areas at different times without needing to physically move them themselves. PM2.5 and Ozone are dangerous for human health. Concentration monitoring can help people make informed decisions on minimizing their exposure as well as equip them with the technology needed to promote policy-change.
Robotic Dog (Git Hub)
The larger goal of my project would be for the dog to be used as a research tool. I would like to make a robotic dog that is able to move around and detect gas concentrations, but there are a variety of other data sampling applications. With added autonomy, this dog would be able to traverse areas dangerous for humans and collect data to send back to researchers. Other more advanced features would be implement SLAM (simultaneous localization mapping), identify and classify objects, or machine learning. The work for this semester serves as a foundation for these future goals. I was able to accomplish the following: assemble mechanical portions of dog, install software, control motors, and detect gas concentrations through raspberry pi.

Additionally, an external tutorial that I used to level my 3D printer bed may be found here. This tutorial is for the Creality Ender 3, the type of printer used for this project. There is code so that the user may adjust the bed on all four corners as well as an stl file that allows one to test the leveling. Below is the desired square pattern that is only achieved through a level bed. This perfect square print confirmed that my 3D printer bed was level
After 3D printing, the assembly of parts occurs next. This is the most important part for a mechanical engineer. The majority of this project derives from this GitHub. Therefore, following the assembly instructions and cross-referencing the CAD model below were sufficient to assemble this robot.
For this project, I used an MQ-2 sensor. This specific gas sensor is apart of the MQ-X line. By replacing the X with the numbers given, you can select a sensor component based on what gas measurements you wish to make. These sensors detect the gas level for a given area. For example, the MQ-2 sensor allows me to measure combustible gas and smoke.

How does these work? There are four pins. One goes to ground and another powers the sensor to 5V. The analog output changes based on the concentration of surrounding gas. An increase in the concentration of surrounding gas leads to an increase in voltage. The Vice versa is true as well. The digital output works similar to a switch: in which the built in LED of the gas sensor is off when gas is not present, and on when gas is present.
The sensor also has a potentiometer for calibration. To do this, You can connect an external potentiometer as well to calibrate. Noted, some sensors such as the MQ-9 one, require several hours of preheating for accuracy. As for gas concentration, I used the following site to calibrate my MQ-2 sensor.
Electrical Wiring
The electronics and software of this project are quite involved. Installing the software is is own project, but to begin I will explain the circuit.

The above is a diagram for all of the electrical connections. From top left and going clockwise, I will explain each section, beginning with the teensy interface. The teensy is an I/O (input/output) microcontroller device that transfers data to and from a computer. For this application, the computer would be the raspberry pi. A teensy is more compact than its Arduino counterpart. The teensy is connected to the ground, transmitter (TX) and the receiver (RX) pins of the raspberry pi (pin diagram here). These pins deliver information to and from the teensy. The teensy is also connected to the raspberry pi through the serial data (SDA) and serial clock (SCL) pins. The SDA is the line that sends and receives data while the SCL carries the clock signal. The raspberry pi is also grounded by the teensy, so that connection must be made. Additionally, the teensy is connected to each motor’s signal wire. Furthermore, the teensy is connected to the IMU (inertial measurement unit). This is an accelerometer that records the forces, angular acceleration, and orientation of a body. The teensy interacts with the IMU through the SDA The teensy grounds the IMU, as well. Finally, the teensy is powered by the IMU’s VCC (voltage common collector) pin. For this project, no sensors were used so the bottom pins of the teensy were not connected to anything.
The motor interface section consists of 12 individual servo motors. These motors receive data from the teensy through the signal pin (M1). These motors require 5V of power, so these are connected to the battery and are grounded by them. However, a capacitor in parallel is needed to ensure that there is enough torque generated to start the motor.
The communications interface is how data is transmitted between the raspberry pi, teensy, motors, and IMU. The IMU is connected to the regulated 5V source with it’s VCC pin. All of the connections for this section have already been described in the teensy interface section. The power section details how the entire system is powered. on The battery terminals are connected to all of the motors and the regulated 5V source is connected to the IMU.
Obviously, these are a lot of connections and wires. To bypass the need for so many wires, a PCB (printed circuit board) is used. This PCB board is custom and was designed by the GitHub creators.


The PCB is fabricated specifically for these circuit connections. The connections are indicated by the red and blue lines. On the physical PCB, the left is where the motors connect, the middle portion is where the teensy is placed (as seen in picture), and the communications interface is on the right. The sensor portion in the middle bottom is unused. Finally, the battery connections are on the bottom left and the 5V source connects to the board on the bottom middle. In real life, the connections look like the bottom figure (not shown is the battery connection):

Installing Software
The software is another significant portion of this project. I ran into many issues and had to trouble shoot a lot. This section is a compilation of what I learned and what one should do if they wish to create this project. These are the software that I downloaded:
- Platform IO
- Visual Studio Code
- Ubuntu
- Raspberry Pi Imager
- ROS Noetic on Raspberry Pi
- ROSSerial on Raspberry Pi
The main bullet points are software that we will be directly using while the sub bullet points are software that we need to download in order to install the main bullet point .Make sure to have at least an 64 GB MICRO-SD card to be able to install software onto the Raspberry Pi. For those mac users, you will need two converters. One for the micro-SD card to USB and then another adapter for USB to USB-C. Note that installing this software will wipe the SD card clean of whatever files were previously on it, so be sure to save those elsewhere if you care about them.
NOTE: It is important before starting the downloads that you check that these software are all compatible with each other. For example, Ubuntu updates yearly and ROS does as well. Depending on the version of ROS, Ubuntu will not be able to run it. I had to use ROS Noetic, which is the latest ROS release. ROS did not release an Ubuntu 20.04 version, so I had to download the compatible Ubuntu 18.04. Unfortunately, there was not a desktop version of Ubuntu 18.04 available, so I first downloaded the server onto my micro-SD card and then installed a desktop once I inputted it into the raspberry pi. This is something important to note because I had to uninstall and reinstall software numerous times after realizing they were incompatible.
The first step would be to download the Raspberry Pi imager. The next step was installing Ubuntu onto the Raspberry Pi. Using Raspberry Pi Imager, you select the operating system that you wish to download as well as the hardware that you want to install it on. The Raspberry Pi 4 is a 64-bit computer, so select that version. Next, changing some of the code in the network configuration file of the SD Card’s system-boot allows you to connect to WIFI. Just changing the router name and inputting a password will make it easy for the raspberry pi to connect to the network once the SD card is in.
After downloading onto a microSD, inputting it into the raspberry pi and connecting the raspberry pi to a computer monitor, keyboard, and mouse, the rest can be downloaded. I ended up not using the monitor that much, and instead used the SSH. So, access your raspberry pi over wifi by getting the serial number. With the serial number, you can log into the raspberrry pi. My login was ubuntu ( I couldn’t figure out how to change it). Thus, my raspberry pi username is ubuntu-ubuntu.
By using the serial number, I could easily log onto the raspberry pi remotely by typing the following in my laptop’s terminal:
Ssh ubuntu@serialnumber
Then after entering my raspberry pi’s password, I was in. I used the terminal to download most of the software. But locating the visual studio code file online using the desktop was also helpful. When downloading studio visual code, make sure that it is an arm64 debian file. That is the file format that the raspberry pi recognizes and will allow you to actually install. You may have to use the terminal for a couple of these software installs. For me, I needed to install a package called libxss1.
Sudo apt-get update –y
And then after that I typed
Sudo apt-get install –y libxss1
I installed Visual Studio using the terminal and the following command:
sudo dpkg -i code_1.55.1-1617807524_arm64.deb
And then I ran it using this command in the terminal:
code
After running VS Code, make sure to install the Python packages before installing the Platform IO extension. Now you finally have PlatformIO as your IDE software!
Now, onto the ROS software. Every year ROS updates their software to accommodate the latest Ubuntu: the Ubuntu 18.04 had ROS Melodic, while, the Ubuntu 20.04 version has ROS Noetic. Before downloading ROS Noetic, you need to ensure that your Ubuntu repositories are open to allow restricted, universe, and multiverse. To do so, simply open up the terminal and use the following command:
sudo add-apt-repository restricted
Then enter password when prompted and press enter to continue. After doing this, the settings for
Repositories should allow restricted ones in Ubuntu. Doing the same for universe and multiverse (separately of course), and then you are ready to download ROS Noetic.
I used the following instructions to install ROS Noetic: http://wiki.ros.org/noetic/Installation/Ubuntu
After installing ROS Noetic, ROS Serial may easily be installed by the following line:
Sudo apt-get install ros-noetic-rosserial
Now, copy the git hub code and folders by the following line:
Git clone https://github.com/OpenQuadruped/spot_mini_mini
To help the raspberry pi find the command from the universal one’s out there, we narrow the search by directing it. Use this line of code:
Export PATH=$PATH:~/platformio/penv/bin
After cloning the repository, go ahead and navigate to the SpotMiniMini folder. Unfortunately, the code references files that were not included in the github. You need to also download those files from a host repository. The Ada-fruit orientation sensor was used for this, and Ada-fruit actually has a public repository. The files that you need are there, typing this into the terminal gets what you need:
pio lib install “adafruit/Adafruit Unified Sensor”
pio may not be a command, in that case, go ahead and install a toolset or update or upgrade. Before installing anything, it is good to make sure that the raspberry pi is up to date on software because those have important commands that let you work with other software.
Finally, all of the software is downloaded. Run the following code in the terminal to begin interacting with the teensy:
platformio run –t upload
You should get something like the following:

In this module, you will learn how to power servo motors with a battery. The teensy is only designed to receive power from the power rail when connected into the PCB. We will be following this diagram from the GitHub:
 For our purposes, we will not be using a Jetson nano, nor the voltmeter. The battery provides 8 volts of power. Since the motors operate at 5V, we need a UBEC (universal battery eliminator circuit). This part, also known as a step-down converter, converts the 8V to 5V. This ensures that the motors are not operating at a voltage they are not suited for (and could possibly break at). The power connects to power and the ground connects to ground. The switch allows us to end the power supply. There are three pins: one for power, one for ground, and the third connects to the part of the circuit we want to switch on and off. The battery is charged through a battery charger and is connected in series to the switch, UBEC, and PCB. Finally, the PCB delivers power to the components through the power rail that they are connected to. These connections are all done by solder and a T-Type XT60 connectors.

To begin, first start with the switch and a t-type connector. The bronze end of the switch is ground, the middle prong is power, and the third pin switches whatever you are connecting on and off.

Then, put some solder on each of the three pins. The T-Type connectors have a ground (black) and a power (red) wire. To make soldering easier, strip off the end coating with wire strippers or simply just cut off the metal ends. Stripping the wire exposes the inside of the wire. This part is much easier to apply solder to and it stays better. Apply some solder to each end. Then connect grounding wire to grounding pin and the power wire to power pin.
The other end of the T-connector fits into the battery. Since the battery powers 5V, we need to now introduce the UBEC into the circuit. Once again, solder the wires of the UBEC on their own. Then, connect the ground (black) wire to the ground pin of the switch. Connect the power (red) wire to the third pin (unused) pin of the switch. Next, we will solder the other side of the UBEC to the PCB. By referencing the PCB Diagram, we know that the circle (left terminal) corresponds to ground and the right (square) corresponds to power. Thus the red wire is soldered to the left and the black on the right. Connecting the T-connector to the other side, we can connect the battery.

Switching on and off works. Testing the voltage at the terminals of the PCB should give a reading of 5V. If this is true, then this is a working power supply.
The final lesson allows you to actually control the motors. Path planning with Bezier Curves is detailed in the instructional video lecture two sections from now. Unfortunately, due to issues with the teensy, I was unable to program it to control the motors with Bezier Curves. Despite this, I figured out how to control the servo motors using the raspberry pi. Connecting the servo motors to the ground, power, and a GPIO pin of the raspberry pi allows you to easily control the motors. The following tutorial features this.
This project uses Python scripts run on a Raspberry Pi microcontroller to send GPIO PWM outputs to a servo motor to set its angle. A servo motor is a type of DC motor that, upon receiving a signal of a certain frequency, can rotate itself to any angle from 0-180 degrees. The way a servo motor reads the information it’s being sent is by PWM (pulse width modulation). Depending on the length of the pulse, the servo moves to a certain angle. Servos will set to 0 degrees if given a signal of .5 ms, 90 when given 1.5 ms, and 180 when given 2.5ms pulses.
Using this information, I was able to make the robot dog move in the following way:
An improvement for the future would be to implement a more sophisticated program so that it can path plan and feasibly walk.
In this video, one will learn about Bezier Curves. First, the topic is introduced with useful applications. Then, the mathematical formulas are derived for the linear, quadratic, and cubic functions. Higher order Bezier Curves are shown without equations, but can easily be derived using the following formula:

As explained in the video, the Bezier curve is calculated by a linear combination of smaller order Bezier Curves. These functions are all defined by Binomial theory. After the math, the specific application for this project is shown as the original GitHub uses a 12-point Bezier curve. Finally, the motor control for my project is shown to further assert that path planning is essential for a successful gait.