The Concept
Abstract
- The outbreak of COVID-19 changed every people’s life and leads to countless death. Because the COVID-19 is highly infectious, to slowdown the its spread, the isolation of confirmed patient is necessary. Also, the patient is weak and always has a fever. So, a comfort temperature and humidity is very helpful for recovery. In this project, we try to design a novel patient isolation system, which use a PID controller to keep the temperature and humidity inside the comfort zone. We hope this project can improve the isolation environment of the patients and slowdown the outbreak of COVID-19.
Introduction
- Background/Motivation
- Why do you consider this experiment a need in the curriculum?
- It relates to duke undergraduate courses: ME 344L Control System and ME331L Thermodynamics. In ME 344L Control System, students learn to model dynamic systems and characterize time and frequency domain response with respect to particular inputs. In order to let students who take this class have a comprehensive study on dynamic systems with feedback control, we offer a simplified HVAC system of a controlled space which applies feedback control to modify the response of the systems(heating pad, cooling module, humidifier, etc.) based upon the psychrometric chart. Our device can also be used in ME331L Thermodynamics class. We collect data from the model to observe the first law of thermodynamics with the energy equation. Temperature and humidity measurements were used to calculate the energy input and output of each control unit; energy conservation in the enclosure were examined.
- Provide proof that this project is relevant, timely, and necessary.
- The 2019 New Coronavirus (2019-nCoV) is a new type of coronavirus and is extremely contagious. It is mainly transmitted through direct transmission and contact, so isolation is essential for treating and transferring patients suffering from COVID-19. The goal of our research on HAVC optimal control is to provide patients a more comfortable environment.
- Do you have faculty, student, and technical staff interviews that justify this need?
- Professor Sophia Santillan, Professor Nico Hotz and Professor George Delagrammatikas consider our device is a learning tool for undergraduate mechanical engineering students. Reproducing the following experiment would lead to a better understanding in the fields of thermodynamics, psychrometrics, heating, ventilation, and air conditioning (HVAC) systems, building management, feedback process control, and basic principles of electric circuitry.
- Why do you consider this experiment a need in the curriculum?
- Theory
- What are the fundamental governing equations that describe your system?
- Psychrometric chart: a psychrometric chart shows the range of temperature and humidity of a comfortable environment. The figure below shows how the psychrometric chart looks like. The x-axis indicates the dry bulb temperature of the surrounding air. The dry bulb temperature is the temperature of the air that is read from the thermometer. Increasing and decreasing the dry bulb temperature would be moving right and left along the psychrometric chart respectively. The green diagonal lines that are about 20 degrees below the horizontal axis indicate the wet bulb temperature. The wet bulb temperature is the lowest temperature that can be reached by evaporating water into the surrounding air. Relative humidity is the ratio of how much water vapor is in the air to how much water vapor the air can hold without the water vapor condensing. For example, if the relative humidity is 100% that means no more water can evaporate into the air, otherwise there would be condensation. As seen in the chart, relative humidity varies as temperature varies. This is because in higher temperatures the air is able to hold up more water vapor than colder air. Moving up and down along the psychrometric chart would show humidifying and dehumidifying process. To humidify a room, would just be adding water vapor into the air which is fairly simple. However to dehumidify a room, water vapor cannot be simply removed out of thin air. To overcome this challenge, the air must be cooled lower than the point where the relative humidity is 100% so that the water vapor can condense and there would some form of precipitation removing the water vapor from the air. This essentially lowers the relative humidity, and the air would be heated back to its original temperature before it was cooled.
- What are the fundamental governing equations that describe your system?

Figure 1. Psychrometric Chart
-
-
- PID controller: PID controller refers to the proportional–integral–derivative controller. It’s a control loop mechanism employing feedback, which improves stability and optimize control of the system. In HVAC systems, various motors and devices need to be controlled with modulated signals to turn damper actuators and hydronic reheat valves. Most controllers in the industry do this using specific and standard logic, called a Proportional Integral Derivative (PID) controller, or PID Loop. PID is mathematical logic that provides these three functions as parameters that can be tuned, so devices function accurately and optimally. A setpoint is the desired state of something (temperature, pressure, humidity, etc.). This is usually a stable function, such as 70°F for room temperature, 0.03” W.C. of room positive pressure, or relative humidity between 40%rh and 60%rh. PID math is then applied in order to compensate for equipment or process variations such as changes in weather or if a door is left open. A change is sensed, adaptations are made, and then the process is looped back and repeated. The PROPORTIONAL (or Gain) component depends only on the difference between the setpoint and the measured process variable. High gain tends to generate particularly aggressive corrective actions. INTEGRAL is the sum of all measured process variables since the process was started. This term is designed to drive steady-state in the setpoint. And DERIVATIVE is the rate of change. A formula uses all three terms to control equipment to the desired results. Tuning a PID Loop sets optimal parameters in each variable to get an ideal response from a control system. There are different methods of tuning, but a common one is “guess and check.” That is, set variables by experience with that equipment and then check the results. Is the equipment performing as desired? If not, tune some more.
-

Figure 2. PID Controller
- Problem Formulation
- Functional requirements:
-
-
- Control the temperature and humidity to reach a set comfort zone automatically basing on the psychrometric chart
- Collect data from the model to observe the first law of thermodynamics with the energy equation
-
-
- Engineering specifications:
-
-
- Build a rig that automatically reaches a set comfort zone no matter the initial condition
- Provide a learning tool for undergraduate mechanical engineering students.
-
-
- Overall design philosophy:
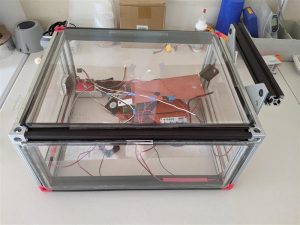
- The rig is divided into three four main components: heating, cooling, humidity, and air supply control. These four components are connected to a four-channel relay, which is connected to a single Arduino main board. The Arduino receives signals from the temperature and humidity sensor, as well as the oxygen sensor. A line drawing of the rig has been included as figures below. The blue line represents the air flow.
- Overall design philosophy:

Figure 3. Front View of the Rig

Figure 4. Top View of the Rig

Figure 5. Control Schematic
Design Process and Planning
- Ideation, design alternatives
- List the design alternatives that you explored in developing your project
- Ranking of ideas
- What ranking system did you use?
- How did you manage your project?
- Who was in charge of what?
- Jiayuan Hu – Electronics/Arduino/Simulation
- Jiabi Yang– CAD/Assembly/Website
- What were all the tasks you identified early on?
- Which ones did you not think about at all? (Save this item for the lessons learned in the Conclusion)
- Who was in charge of what?
Prototyping
- Parts, Bill of Materials
- Arduino UNO R3
-
4-Channel Relay Module
-
Temperature and Humidity Sensor
- HiLetgo TEC1-12706 Semiconductor
- 80X100mm Heating Pad
- Hygrometer Thermometer
- 4 Fans
- Temperature Sensor
- Ultrasonic Mist Maker
- Arduino Code for PID control
#include <DHT.h>
#define DHTTYPE DHT11
float target_t = 25;
float P = 2;
float I = 0.5;
float D = 1;
float sensor_k = 1;
float now_t = 20;
float p = 0;
float i = 0;
float d = 0;
float p_old = 0;
float output = 0;
const int input_pin = 8;
const int heat_pin = 3;
const int cool_pin = 5;
const int mist_pin = 6;
const int fan_pin = 9;
const int period_ms = 500;
const float period = period_ms/1000;
DHT dht(input_pin, DHTTYPE);
/*
float target_m = 30;
float m_P = 2;
float m_I = 0.5;
float m_D = 1;
float m_sensor_k = 1;
float now_m = 20;
float m_p = 0;
float m_i = 0;
float m_d = 0;
float m_p_old = 0;
float m_output = 0;
*/
void setup() {
pinMode(heat_pin, OUTPUT);
pinMode(cool_pin, OUTPUT);
//pinMode(mist_pin, OUTPUT);
pinMode(fan_pin, OUTPUT);
Serial.begin(9600);
analogWrite(fan_pin,128);
}
void loop() {
now_t = dht.readTemperature();
//now_m = dht.readHumidity();
p = target_t – now_t;
i += (p+p_old)/2 * period;
d = (p-p_old) / period;
p_old = p;
output = P*p + I*i + D*d;
if(output>0){
analogWrite(heat_pin,int(min(output*25,255)));
}
else{
analogWrite(cool_pin,int(min(-output*25,255)));
}
/*
m_p = target_m – now_m;
i += (m_p+m_p_old)/2 * period;
d = (m_p-m_p_old) / period;
m_p_old = m_p;
m_output = m_P*m_p + m_I*m_i + m_D*m_d;
if(m_output>0){
analogWrite(mist_pin,int(min(m_output*25,255)));
}
else{
analogWrite(mist_pin,0);
}
*/
delay(period_ms);
}
- Manufacturing processes used
- Also discuss which processes you would recommend if you were building many more units
- Think about design for assembly, manufacture, maintenance/servicing
- How much have you considered the user experience?
Testing/Experimentation
- Preliminary results
- Debugging and shake-down of experiment
- Make sure all the systems communicate and work
- Analysis, Discussion
- Your results may not be what you expected
- Consider why this may be the case
- If you are able to get data that can be analyzed rigorously (not expected), what methods would you use to reduce the information into generalizable knowledge?
Conclusion and Future Work
- Lessons learned
- How would you do things differently the next time you design?
- What advice do you have for someone who wants to replicate your project?
- Next steps
- How would you advise the next group of students who take on your project?
- What other types of experiments can now be performed on the same system?
Acknowledgments
References
Balancedbot
Appendices
- Calibration procedures for all sensors
- Include data sheets
- Experimental procedure
- Preliminary results (tables of raw data)
- Statistical analysis; sample calculations