
Abstract
In this project, we made an experimental setup to test and show the behavior of a vibrating string. The setup can adjust the string to different tensions, vibrating length, and of different types. The moving guitar pick allows us to trigger the vibration at different locations on a string and the moving sensors for monitoring the behavior at different locations. The pluck of the string can be applied at an instance, or at a certain frequency. Given all the flexibility, this system should be able to demonstrate all the behavior of a vibrating string governed by the wave equation. The mechanical part of the setup is mainly standard T-slotted rails and its auxiliary components, and 3D printed components. The electronics are mainly handled through the Arduino. We will discuss the theory of wave equation, designing process, and lessons learned. Due to this pandemic, we are unable to carry out an actually experiment on the setup, but we will give some preliminary results and discussion.
Introduction
Motivation
For our MEMS graduate capstone course, we were assigned to design and construct an experiment that can be helpful for the undergrads at Duke. In looking through the undergraduate course and going over many ideas, we found that there was a lack of vibrations experiments in the undergraduate curriculum and we thought the study of a guitar string might be a simple yet fun subject to base our experiment on. We think our experiment can pair well with the current undergraduate course, ME445: Introduction to Vibrations. In the course, students learn about many vibration characteristics and responses to impulse and periodic excitations. There is also importance placed on the application of analytical and numerical methods using FEM to find solutions to vibrations control problems. Music is a shared interest of many students and studying a vibrating string serves as a good entrance to basic vibration theory study.
Theory
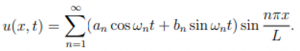
Our experimental setup features a string that is fixed at both ends ( x = 0 and x = L ) with constant tension T and density ρ, initial displacement f(x), initial speed g(x). Displacement u(x, t) is governed by the wave equation.![]()
![]()
we can have an approximation of the real solution as
with![]()
![]()
for each mode, the shape of the vibration is controlled by
![]()

given the theory, we know that if we pluck the string
- instantaneously at any location, the visual result of the vibration largely comes from the major mode (n=1)
- a certain mode’s frequency
- at a node’s location (a point on the string not moving in a single mode), the string doesn’t vibrate (for example, the middle for n=2)
- at a location other than a node’s, the string will present a single-mode vibration.
Functional Requirements
In thinking of what functional requirements and design philosophies needed for this experiment, we needed a frame that would be able to handle 10-30lbs of tension from the guitar string, the ability to record frequencies from 50-400Hz (common frequency range for a guitar string), a setup that was easily transportable (<20lbs), and a design that allowed the setup to be easily modified and user friendly.
Some peer-reviewed references used during the design of the experiment includes:
- BYOE: Mobile Experiment for Signals and Systems – Analysis of a Guitar String
- Incorporating Musical Instrument Design Into A Freshmen Engineering Course
Some other high-quality references used for this experiment include:
- MATH 551: Applied Partial Differential Equations and Complex Variables course note. Jeffrey Wong
- Principles of Vibration by Benson H. Tongue
Design Process and Planning
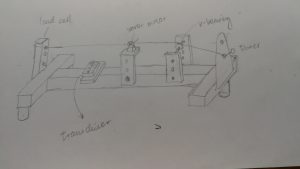
Initial scratch drawings and basic CAD models:
We realized there was a lot of work ahead of us, some of the tasks we knew we needed to do included:
- Plucking bar design
- Arduino coding/electronics
- Sliders’ layout
- Simulation
- Visualization of the amplitude
The work was split up between us
- Andy Bae – Electronics/Arduino/Post-processing
- Bo Zeng– Mechanical design/CAD
Many alternative designs were discussed and explored throughout the development of our project:
- 1. a base to hold all the component:
- modify from a second-hand guitar (X, the shape and size of the guitar and the short distance from the string to the body raise a problem in plucking)
- utilize T-slotted rails to build one(O, standard components, with plenty of auxiliary components, like sliders, connectors, easily purchased online)
- three long rails in parallel to be wide enough to hold the transducer (X, waste of material)
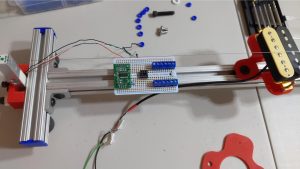
- two short rails to hold the string and load cell on both ends. 3D print a connector for the transducer to be fixed on the single long rail between the two short ones. (O)
- three rubber feet under the rails to secure a stable plane
- 2. about the string
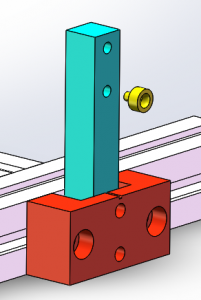
- Tension in the string is detected by loadcell
- 3D print a connector to fix the loadcell on the rail when they don’t share bolt of same type
- 3D print a nut (yellow) with dimension on one end fit the hole of loadcell and on the other end preventing the head of the string to pass through.
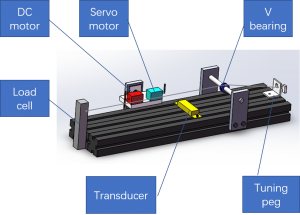
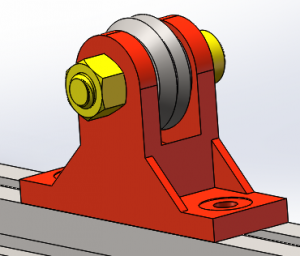
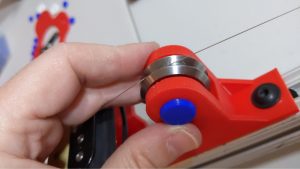
- String length can be changed by v bearing mounted on a slider
- Sting tension can be changed by tuning peg
- Use a motor with a bar to pluck the string instantaneously or a certain mode’s frequency at a certain location
- Use a transducer to obtain the frequency at one location along the string
- Tension in the string is detected by loadcell
- 3. visualization
Use a high exposure camera to capture the vibration amplitude. A light from above to light the outline of the string. A camera above captures the amplitude against the black background. (X, did not realize it during the pandemic)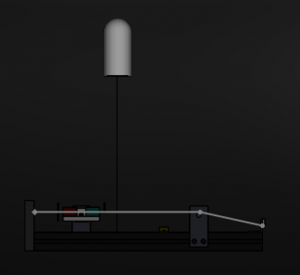
How we decided if one idea is better than the other:
In general, we want a stable platform of low cost but also convenient for moving parts during the experiment, and changing components in the future. The framework is based on strong and interchangeable standard components. To decrease the weight of our design, we make the number and the size of the rail smaller. The screw holes on one component face one direction, so the people adjusting them do not need to switch direction. The total cost of buying components did not exceed 100 dollars, excluding the 3D printed ones.
Prototyping
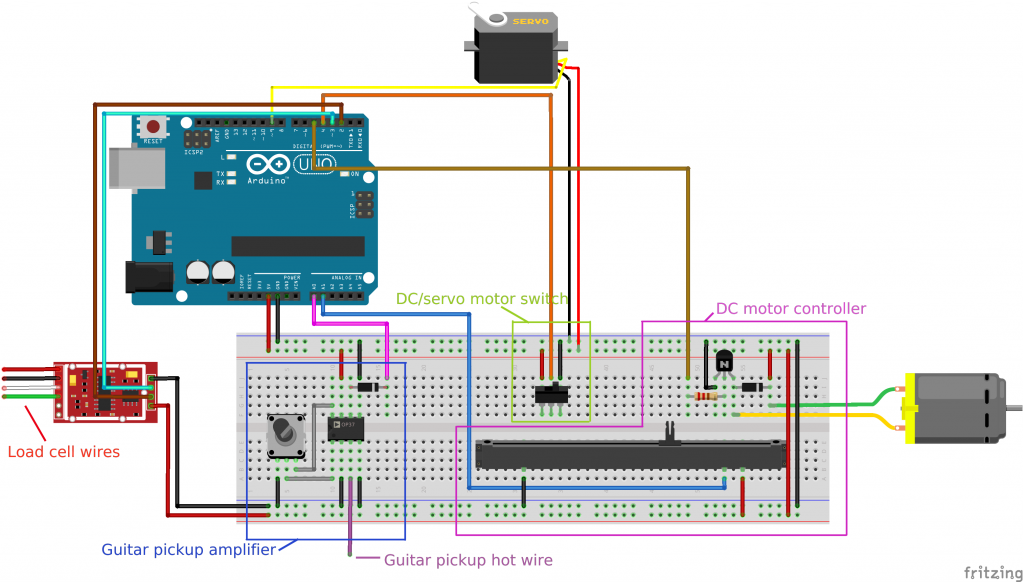
Parts, Bill of Materials
- Arduino UNO
- 20kg load cell w/ HX711 amplifier
- Guitar pickup
- Guitar pickup amplifier
- IN122P op-amp
- 1kΩ potentiometer (controls amplifier)
- 1N4001 diode
- Switch (ON/OFF for servo motor OFF/ON for DC motor)
- 5V Servo motor
- 3V DC motor
- DC motor controller
- Linear potentiometer
- PN2222 transistor
- 1N4001 diode
- 270Ω resistor
- T-slotted rails(1010 series)
- brackets, rubber foot, and connectors for the rails
- Electric guitar strings
- string tuner
- 3D printed: a holder for v-bearing, a set of bolt and nut to fix the v-bearing, a holder for pickup, a connector between the string and the loadcell, a connector between the loadcell and the rail.
Code developed for this project as well as instruction on how to use the code is located in the appendix.
Due to circumstances from the pandemic, our manufacturing process was limited to 3D printing
- For user experience, we realized the following points:
- Ease of use and configurability was thought of
- Arduino/simulation code to be well commented (once verified)
- the whole setup is light to lift up and could hang on the wall to save room
- For fasteners that will be frequently loosened and fastened, they should be facing the same direction so that the operators don’t need to move from side to side
Testing/Experimentation
Although we weren’t able to run our experiment, we were able to get some preliminary results by running a dummy signal into the code to verify it.
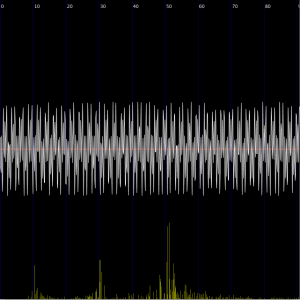
- Using a dummy frequency composed of a 10, 30, and 50Hz wave. We can see that the processing code can correctly show the wave in the frequency spectrum.
- Next, we will have to make sure all systems are communicating properly.
Analysis, Discussion
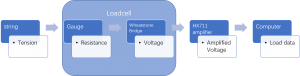
A focus of the course was to study how error can have an effect on our results and to do this, we must consider the error propagations in our systems. For our experiment we had two main sources of data, one from the load cell and one from the guitar pickup.
- Flow chart of data for loadcell
-
- The combined error of this loadcell is +-0.05%FS, the range of input is 0~20kg, so the maximum absolute error of output is +-10g. One way that more error may be introduced into the final output is by the amplifier, the noise in the data becomes big enough so the code does not take it as noise, thus it enters the resulting data for loading.
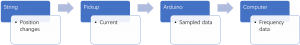
- Flow chart of data for pickup
-
- Errors are introduced by sampling and code processing. The clock inside Arduino is 9615Hz, divided by two we get the Nyquist frequency 4807.5Hz, which is the highest frequency we can sample by this Arduino component. The sampled data is processed in code by a Discrete Fourier Transform (with limited terms). Both processes would only give an approximation to the input.
Calibration
- We take the musical tuner App as a reference. Set the string to make a certain note, say C4, which is of frequency 261.63 Hz. Pluck the string once and compare the resulting frequency we get from the pickup. Adjust the calibration factor in the code processing the output of the pickup accordingly. Then we use the wave equation to calculate the major mode frequency from string tension obtained by loadcell. Compare the resulted frequency to 261.63 Hz, adjusting the calibration factor in the code for loadcell accordingly.
Conclusion and Future Work
- Lessons learned
- a lesson learned in 3D printing: 3D printers don’t necessarily guaranty the product’s dimensions are exactly as in the STL file. The track of the printer’s tip is the outline of your 3D model, which added the radius of the additive material is the true dimension of your product. Bear that in mind when designing components that have to fit a certain size, like bolts and holes. If your printer’s software provides you with error control, set that before printing. If not, you either replace your design with the purchased item or shrink your dimension to fit the tip deviation.
- Next steps
- Since we failed to carry out the experiment, we rely that on the next group of students. If ever possible, please change the connector between the loadcell and rail to a stronger one. Please come up a best way to hold the plucking part, which we did not have time to implement our first design and improve it.
Acknowledgments
We would like to thank all the people who have helped us during this project, Professor George Delagrammatikas, Professor Sophia Santillan, Professor Nico Hotz, our TA Ian Eldridge-Allegra, and all of our classmates. It has been a stressful time to finish the second half of the project in a pandemic. It’s thanks to the accommodations of the faculty and the support of our fellow classmates that we were able to continue working on this project.
Appendices
Designs
link to STL file of all the 3D printed design:
Arduino code
Arduino code was developed to collect the data from the load cell and guitar pickup as well as control the motors for instantaneous and periodic excitations:
#include

#include "HX711.h"
#define calibration_factor -7050.0
#define DOUT 3
#define CLK 2
Servo servo;
HX711 scale;
const int oscilAnalogInPin = A0;
const int spdCtrlAnalogInPin = A1;
const int motorPin = 5;
const int switchPin = 4;
int DCSpd = 0;
int servoSpd = 0;
int servoPos = 0;
boolean isServoClock = true;
boolean isDCon = false;
void setup() {
pinMode(motorPin, OUTPUT);
pinMode(switchPin, INPUT);
servo.attach(9);
Serial.begin(9600);
scale.begin(DOUT, CLK);
scale.set_scale(calibration_factor);
scale.tare();
}
void loop() {
//motor control
if(digitalRead(switchPin) == HIGH) isDCon = true;
else isDCon = false;
if(isDCon){
DCSpd = map(analogRead(spdCtrlAnalogInPin), 0, 1023, 0, 255);
if (DCSpd >= 0 && DCSpd = 180) isServoClock = false;
else servoPos += servoSpd;
}else{
if(servoPos – servoSpd > 8) & 0xff );
Serial.write( oscilVal & 0xff );
//load cell
Serial.print(scale.get_units(), 1);
Serial.print(” lbs”);
Serial.println();
}
- Note the HX711 load cell amplifier library will need to be installed for Arduino to work properly
Processing code
Processing 3 code was also developed and is run alongside the arduino code for post-processing the data from the guitar pickup for visualization as well as analysis of the frequency spectrum:
import processing.serial.*;
float pi = 3.1415926535;
Serial port; // Create object from Serial class
float val; // Data received from the serial port
float[] values;
float zoom;
float calibration = 1/6.7;
int bands = 1024;
float[] spectrum = new float[width];
void setup() {
size(640, 640);
// Open the port that the board is connected to and use the same speed (9600 bps)
port = new Serial(this, Serial.list()[0], 9600);
values = new float[width];
zoom = 1.0f;
smooth();
}
float getY(float val) {
return (height – val / 1023.0f * (height – 1));
}
float getValue() {
float value = -1;
while (port.available() >= 3) {
if (port.read() == 0xff) {
value = (port.read() << 8) | (port.read());
}
}
return value;
}
void pushValue(float value) {
for (int i=0; i<width-1; i++)
values[i] = values[i+1];
values[width-1] = value;
}
void drawLines() {
stroke(255);
int displayWidth = (int) (width / zoom);
int k = values.length – displayWidth;
int x0 = 0;
float y0 = getY(values[k]);
for (int i=1; i<displayWidth; i++) {
k++;
int x1 = (int) (i * (width-1) / (displayWidth-1));
float y1 = getY(values[k]);
line(x0, y0, x1, y1);
x0 = x1;
y0 = y1;
}
}
float[] calculatefft(float[] values){
float[] spec = new float[width];
for (int i=1; i<width; i++){
for (int j=1; j<width; j++){
spec[i] = spec[i] + values[j]*cos((-pi*i*j)/width);
}
}
return spec;
}
void drawfft(){
stroke(128, 128, 0);
for(int i = 0; i < width; i++){
// The result of the FFT is normalized
// draw the line for frequency band i scaling it up by 5 to get more amplitude.
line(i, height, i, height – spectrum[i]*height/50000 );
}
}
void drawGrid() {
stroke(255, 0, 0);
line(0, height/2, width, height/2);
stroke(0,0,100);
for (int i=0; i<(width/(10/calibration)); i++){
line(i*(10/calibration),0,i*(10/calibration),height);
textSize(10);
text(str(10*i), i*(10/calibration)+2, 20);
}
}
void keyReleased() {
switch (key) {
case ‘+’:
zoom *= 2.0f;
println(zoom);
if ( (int) (width / zoom) <= 1 )
zoom /= 2.0f;
break;
case ‘-‘:
zoom /= 2.0f;
if (zoom < 1.0f)
zoom *= 2.0f;
break;
}
}
void draw(){
background(0);
float freq = 100;
//for dummy signal: val = round(512.+(100.*sin((50.*millis())/1000.))+(50.*sin((30.*millis())/1000.))+(50.*sin((10.*millis())/1000.)));
val = getValue();
if (val != -1) { //update values
pushValue(val);
}
spectrum = calculatefft(values); //update dft calculation based on past measurements
drawfft();
drawGrid();
drawLines();
}
- A download to Processing 3 can be found here.
- Run this code after the Arduino starts printing to the serial monitor.