
Abstract
The performance of a FASE car on corners and skidpad strongly relies on the interaction of its suspension and aerodynamics systems. In current vehicle, the lack if accurate suspension force measurement, and the old aerodynamics models make it difficult to figure out the traction limits and optimal performance under extreme conditions. This project developed a methodology that combines the suspension force and aerodynamics analysis to determine and improve the performance of racecar. The liner potentiometers and the whole vehicle electronic system helped to measure wheel displacements and reconstruct the forces at each corner of the suspension. CFD simulations were used to obtain the drag, lift, and downforce coefficients for various operating conditions around a skid pad. The resulting framework facilitates the evaluation of design changes and supports the development of a more efficient aerodynamic package for the next-generation car, with the overall objective of reducing skid-pad lap time and enhancing on-track performance.
Problem statement

The racecar’s performance at corners and on the skid pad is highly dependent on the interaction between its suspension and aerodynamic subsystems. However, the current system lacks accurate data acquisition, refined simulation models, and optimized aerodynamic design, making it difficult to determine the traction limits of the car. This project aims to integrate suspension force measurement and aerodynamic analysis into Matlab and CFD simulations to identify, refine, and optimize the traction limits, ultimately reducing lap times and improving overall performance.
Objectives
Find the traction limits for the racecar to have the best lap time around a skidpad.
1. Suspension subsystem
- Figure out the Forces at each of the suspension system by using shock pots(potentiometers)
- Integration of electronic data acquisition system (data logging)
- Refine the matlab code by incorporating CFD results
- Run matlab simulations to plot the newer limits and analyze
2. Aerodynamic subsystem
- Finding the best cd, cl, downforce values for the racecar around a skid pad. (CFD analysis)
- Refine the aerodynamic efficiency and obtain necessary coefficients
- Design a new aerodynamic package for next generation car
Educational Objectives
This project integrates aerodynamics and vehicle dynamics to give the Duke Motorsports Team a deeper understanding of racecar performance. Students will design, test, and validate an aerodynamic package including front wing, rear wing, and side diffuser – using tools like ANSYS Fluent, CFD simulations, and track testing to study the effects of downforce and drag on handling. At the same time, this project will document key principles of vehicle dynamics, creating a resource for new team members to learn fundamentals, solve open-ended problems, and prepare for senior design work. Together, these efforts enhance skills in design, data analysis, and engineering application, while connecting theory to practice in motorsports.
Research Objectives
This project focuses on the optimization and innovative design of an aerodynamic package for Formula Student race cars. The objective is to combine experimental measurements with CFD simulations to study the impact of aerodynamic components on overall downforce, drag, and airflow stability. These results will then be used to create a digital twin of the racecar going around a skidpad on matlab to find the trends with respect to traction limits.
(1) Front Wing Design: Enhance front axle downforce through multi-element structures and angle adjustments, while balancing performance between low-speed corners and high-speed straights.
(2) Rear Wing Design: Employ a high-camber air foil profile to provide maximum possible downforce while maintaining minimal additional drag.
(3) Side Diffuser Design: Improve underbody airflow extraction efficiency, strengthen ground effect, and thereby enhance the overall aerodynamic performance of the car.
(4) Manufacture and assemble a working mount for the potentiometers to track the suspension travel.
(5) Use the above results to understand the trends in the matlab simulation.
These research outcomes will not just contribute to improving the performance of Formula Student race cars in competition. They will also provide valuable insights for teaching and research in aerodynamic/vehicle dynamic optimization methods, structural optimization, and motorsport engineering applications in greater depth.
Design criteria
| INTRO | design criteria list | Value(0-5) |
| maximize the tire contact patch | Optimal Camber Gain | 4 |
| Minimize the mass | Lightweight | 2 |
| Wings and mountings must be sufficiently rigid and strong to withstand the load. | Stiffness | 4 |
| Wings and mountings must be sufficiently rigid and strong to withstand the load. | strength | 4 |
| Generate the maximum possible downforce within the package | Maximize Downforce | 5 |
| Excessive drag impacts acceleration and top speed on straights. | Minimize Drag | 3 |
| Ensure sufficient airflow to radiators and the powertrain to meet cooling requirements | Efficient Cooling | 2 |
| Ensure the engin could handle the speed and the pressure. | Aerodynamic Balance | 4 |
| Excessive drag impacts acceleration and top speed on straights. | Minimize Drag | 2 |
| control body roll and work with the vehicle’s Center of Gravity, keep in the proper post | Roll Center Control | 5 |
| Rule is everything | Rules Compliance | 2 |
Aero subsystem
- Design & development
- front wing – Receives clean airflow, organizes the flow field, and directs it towards the rear of the car.
- Side diffuser – A primary component for generating downforce, utilizing the Venturi effect to create downforce.
- Rear wing – Extracts airflow from the side diffuser to further amplify its effect, while also providing stable rear downforce on its own.
- CFD Simulation
- Racecar & NACA 9412 Airfoil simulation for different angle of attacks.
- Wind tunnel testing
- Validation of simulation data with experimentation at different flow velocities
- Post processing & analysis
- Generating plots and comparing lap times in matlab.

NEW FSAE CAR.
1. Front Wing
The front wing is designed with multiple elements and adjustable flaps. It generates strong downforce at the front axle, improving cornering grip and overall vehicle stability. The flaps can be fine-tuned to balance aerodynamic load according to track conditions.

2. Diffuser
The diffuser extracts airflow from the car’s underbody, accelerating it through the venturi effect. This reduces pressure beneath the chassis, creating additional downforce without a significant drag penalty. Flow structures such as vortex generators are integrated to enhance efficiency and maintain stable airflow.

3. Rear Wing
The rear wing features a multi-element airfoil configuration, designed to maximize downforce at the rear axle. The adjustable main plane and flaps allow for aerodynamic tuning, providing optimal balance between drag and downforce. This ensures high-speed stability and improved traction during acceleration and braking.

Error verification
1. Single wing CFD simulation

MESH FOR NACA 9412 AIRFOIL.

INLET & OUTLET for the ENCLOSURE.
To validate the simulation results, real time testing was important to consider the necessary error between the values and compare the graphs with simulation. A single efficient support mechanism was developed with flexible tilt to change angle of attacks for attaching the airfoil in the wind tunnel. The whole support was then 3d printed with complete infill and abs plastic using Prusa. The test setup and result are as follows:

WIND TUNNEL TEST PROTOTYPE FOR 5 AOA.

STRUCTURE IN WIND TUNNEL.
3. Results


General description
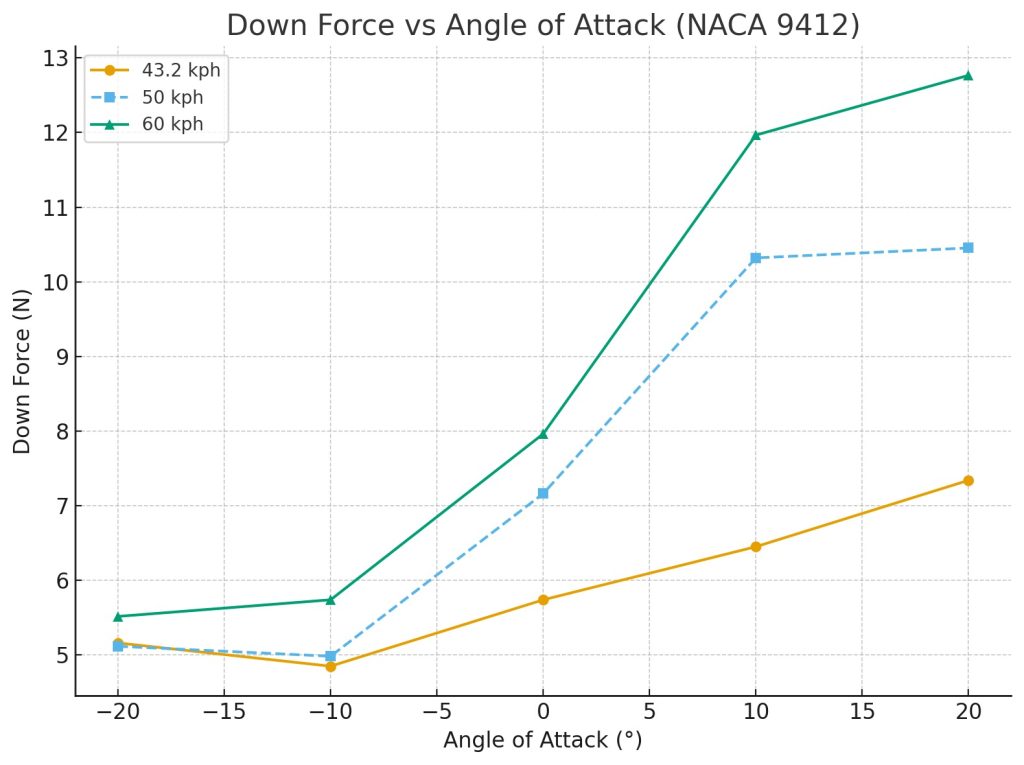
These figures show the relationship between angle of attack (α) and three aerodynamic forces, which are Down Force, Side Force, and Drag—for the NACA 9412 airfoil at three different speeds ,43.2, 50, and 60 kph.
Aerodynamic Trends
(1) Down force
- For all test speeds, the downforce increases with the angle of attack (α).
As α increases, the projected frontal area and pressure difference between the upper and lower surfaces grow, producing a stronger aerodynamic force. - This trend indicates that the NACA 9412 airfoil exhibits stable downforce performance, which increases consistently with both angle of attack and flow velocity.
(2) Drag
- Drag increases slightly at positive angles of attack and decreases at negative ones.
This is consistent with classical aerodynamic behavior, where higher α causes greater flow separation and pressure drag.
- The entire drag curve shifts upward with increasing speed, as drag also scales with dynamic pressure.
(3) Side force
- The side force is smallest near α = 0° and increases slightly at ±10°.
This suggests that side force mainly results from slight asymmetry in the flow field or model installation, rather than a dominant aerodynamic mechanism.
- Its magnitude is roughly one-tenth of the downforce and drag, indicating that it is a secondary effect associated with geometric or flow nonuniformity.
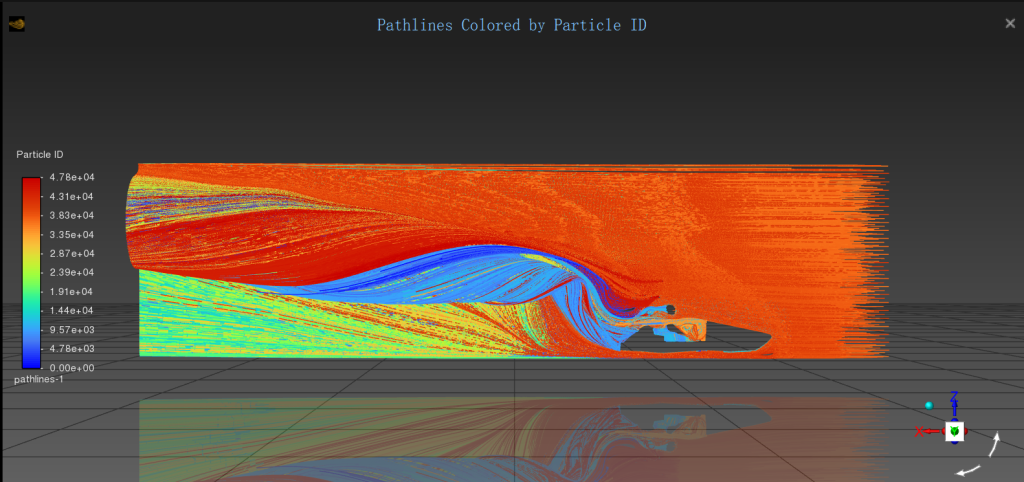
Full car SIM
The full car body simulation was simulated at the speed of 16.67m/s. Here the necessary contact patch for tires was placed to provide suitable roughness to the ground. Here additional necessary parameters were to be obtained for refined MATLAB code – absolute pressure, its coefficients, side forces to optimize loads at wheels, and analyze velocity distributions visualizing flow (like wake patterns and vortex identification). An FSAE design criteria was also considered for The results obtained are as follows:


Aero conclusions
The data implies that the vehicle’s aerodynamic package, comprising front and rear wings, the diffuser, and the undertray, operates efficiently within the tested range. The nearly invariant aerodynamic coefficients demonstrate that the flow field around the car remains consistent with no evidence of partial or global separation. This reflects a well-balanced design in which the aerodynamic center does not shift significantly with increasing velocity, ensuring predictable handling characteristics.
The following are the observed changes
- The downforce for the car increased from 450 N to 900 N.
- The CL/CD ratio increased from 2.3 to 2.5.
- The speed of the car around the skidpads increased from 40 kmph to 46 kmph.
- The skidpads lap time improved from 25 seconds to 20 seconds.
Suspension Subsystem
- Find the traction limits of the racecar to achieve the best lap time around a simulated skid pad.
- Evaluate forces at each of the wheels
- Work in conjunction with aerodynamics to create a digital twin of the racecar.
Overview
This is the race car suspension design for this year, and it’s still in the early stages of preparation. The goal is to receive suspension telemetry data, which allows the team to modify the vehicle for various events appropriately. To achieve this, potentiometer mounts have to be manufactured such that they can measure the travel of the spring and damper. This was accomplished by manufacturing brackets and using existing bolts.
OVERVIEW FOR FORCES ACTING ON EACH WHEEL.
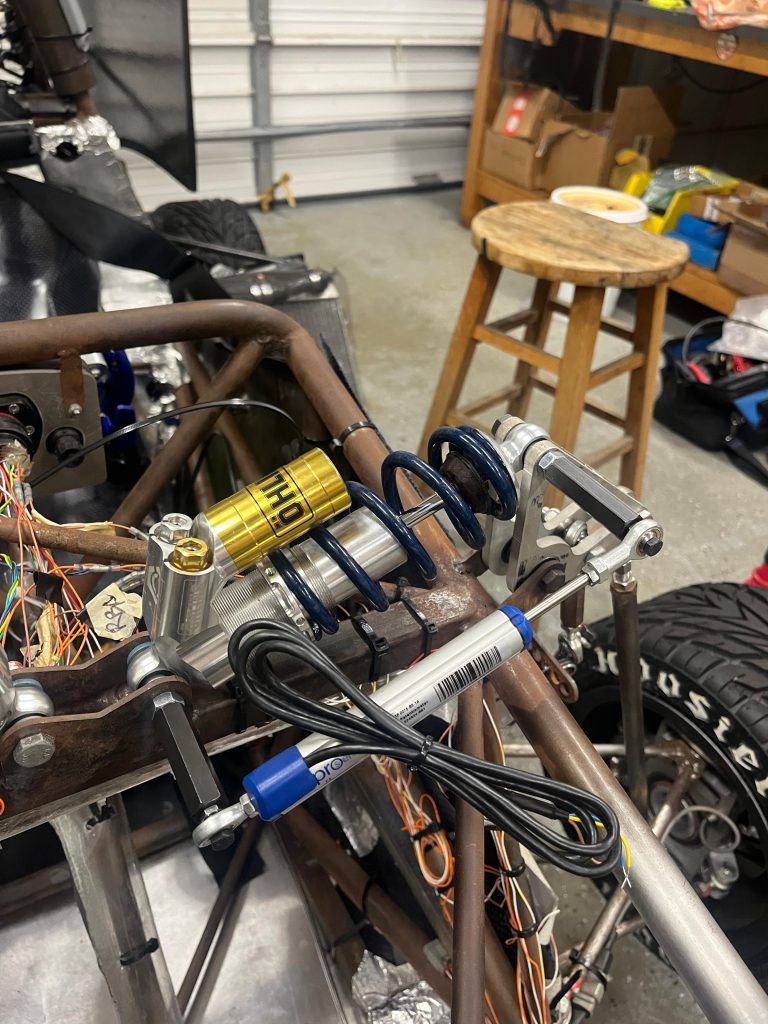
SHOCK POD MOUNTED ON THE FSAE CAR.
The Mounts
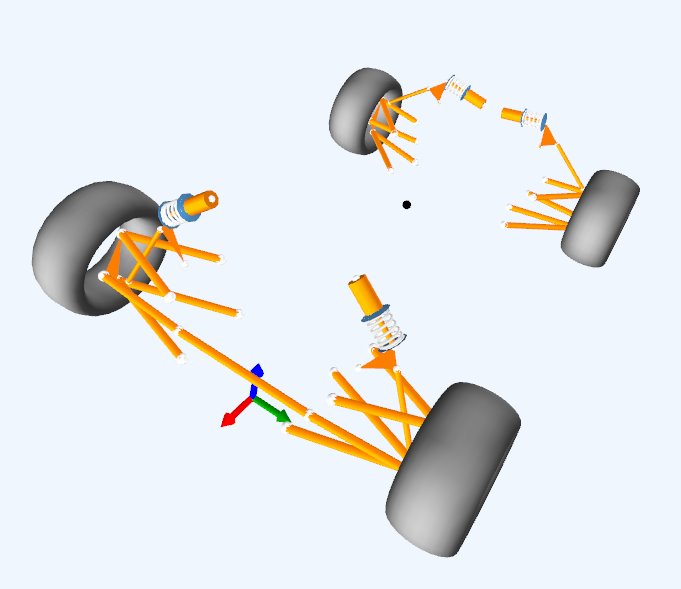
The following sketches represent our concepts for the mountings. These are designed to ensure the shock pot functions effectively while being securely attached to the vehicle’s suspension system. The system is laid out horizontally, with the objective of optimising space utilisation and aerodynamics. Two Öhlins shock absorbers are positioned horizontally above the chassis, thereby enabling the front end to be narrower and lower. In the case of compact vehicles such as FSAE, this results in the creation of cleaner airflow channels for the front wing and underbody. For those on a limited budget, manufacturing and maintenance costs remain relatively manageable. Both the swing arm and the shock absorber mounts are simple components that can be fabricated in school workshops. Subsequent geometry modifications only require adjustments to be made using a laser cutter or welder, eliminating the need to rebuild the entire subframe. With the entire shock absorber system centralised in the vehicle’s midsection, it is relatively convenient to adjust damping, replace springs and route sensors, resulting in shorter maintenance times during competition events.

MOUNTING FREE HAND SKETCH.

POSITION OF NEWLY ATTACHED L-SHAPE MOUNT AND HEX ADAPTER.
The sketch shows the initial design for mounting the linear potentiometer on the front suspension. We set up a local coordinate system and drew a side view of the push rod and rocker in three positions: static ride height, full bump and full rebound. The vertical wheel-centre travel and rocker rotation are marked. We then track the motion of the two potentiometer attachment points from these positions and calculate the total sensor stroke. This value is then compared with the usable stroke of the selected potentiometer, with a safety margin being kept at both ends so that the sensor does not reach its internal stops. The sketch also helps us to check that the sensor body and its bracket will not collide with any nearby chassis members during installation, and that the installation angle will keep side load on the shaft to a minimum. Based on this sketch, we determined the final bracket length and the mounting points on the suspension.
As seen above, a hex-shaped adapter and an L-shaped mount had to be manufactured to ensure the potentiometer stays in place and translates parallel to the damper.
Calculating forces in the wheel

FORCES ALONG THE WHEEL TO CHASSIS.
We have developed a real-time telemetry system for the front suspension of racing vehicles. By installing linear displacement sensors (shock potentiometers) on the shock absorbers, alongside our proprietary mounting structure and calibration algorithms, we can measure suspension displacement and damping velocity in real time on the track. This enables us to calculate the total force acting upon the suspension control arms.
Fspring + Fdamper = Total force in the suspension arms
Fspring = Kx, K = Spring coefficient, x = Displacement
FDamper = Dv, D = Damper coefficient, v = Damper velocity
Potentiometer Calibration

CALIBRATION GRAPH – POTENTIOMETER/SHOCK POD.
This plot is the calibration curve of the linear potentiometer, showing the relationship between output voltage (V) and displacement (mm). That is the significant linear relationship. The potentiometer was translated back and forth multiple times to eliminate the gaps. The values were then logged for multiple iterations to account for errors.
Simulation
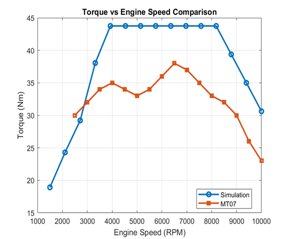
TORQUE VS ENGINE SPEED GRAPH.
At the beginning of the project, the torque curve used in the simulation did not match the real MT-07 engine. To fix this, we took the official torque data from the Yamaha website and digitized the MT-07 torque–speed curve. The orange line in Figure X shows the reference MT-07 torque
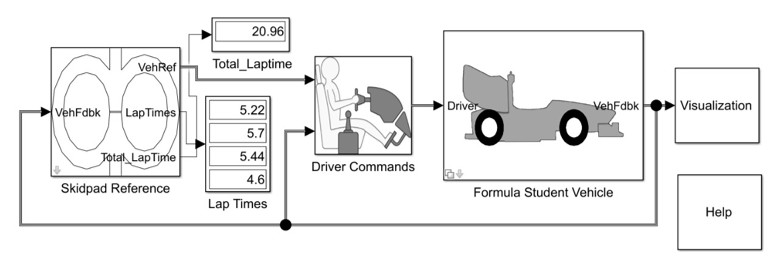
MATLAB SIMULATOR FOR SKIDPAD.
The skidpad simulation can be seen running in the above video. Also shown alongside in real time are the forces in each wheel, and a lateral vs. longitudinal acceleration visual. The speed-torque curve of the engine is the exact same as the one in the FSAE racecar. The driver’s gear selections are also timed by a shifting schedule that does not permit the simulation to shift above the 2nd and 3rd gears, which are the highest gears used around a skidpad, as confirmed by the Duke FSAE drivers. Also shown is a snippet from MATLAB’s Simulink, which shows a flow chart-like block diagram of the code.
Simulation Results

GRAPHS
This set of plots shows the powertrain and control logic under different conditions. During the acceleration phase, the shift schedule correctly triggers upshifts based on the engine speed threshold. If multiple drivers were to set a lap time around the skidpad, these outputs would help engineers pick the best driver for that specific event or coach the slower driver to push in certain sections.

TORQUE VS RPM GRAPH
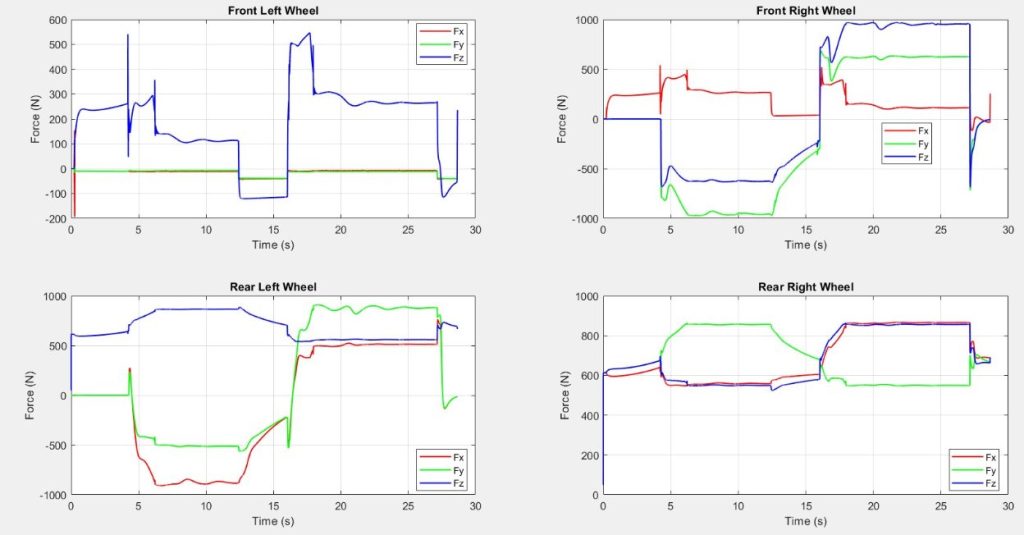
FORCES ALONG EACH WHEEL GRAPHS.
These plots show the response of the vehicle under extreme conditions. The 4 plots above depict the forces in each of the wheels in the X, Y, and Z directions. This data allows engineers to pinpoint which wheel is on the limit to set up the car accordingly for the track.
To summarize, the potentiometers will be used to gather suspension travel data, which in turn can help the team identify the effects of the aerodynamics implemented on the car. Both sub-teams must work hand in hand with the drivers to better understand the handling and limits of the vehicle. The CFD simulation results are also used in Matlab to bring the digital twin as close to the real racecar as possible.
The numbers may in the sim and in actuality may not be the same. The engineers will be looking for the trends and shifts in simulation results to predict the results on track and determine credible research and development for the next-generation racecar.

OVERVIEW OF THE COMPLETE PROJECT.
Rendered New Fsae Car

RENDERED NEW FSAE CAR.
MEET THE TEAM

CHENGCHUAN SHU, MS MEMS, DUKE UNIVERSITY.
THAKUR PRANAV, MS MEMS, DUKE UNIVERSITY.

OMKAR BHAT, MS MEMS, DUKE UNIVERSITY.

XINGRUI CHEN, MS MEMS, DUKE UNIVERSITY.
References
- Aerodynamic Of Formula SAE Race Car.
- Gillespie, T. D. (1992). Fundamentals of vehicle dynamics. SAE International.
- H. B. Pacejka, Tyre and Vehicle Dynamics. Oxford, UK: Butterworth–Heinemann, 2002
- Bartolomeo, M. V., Lombardo, A., Colella, M., & Delagrammatikas, G. J. (2019). Measuring the traction limits and suspension forces of a formula SAE racecar. In ASEE Annual Conference and Exposition Conference Proceedings.
-
M. Guiggiani, The Science of Vehicle Dynamics: Handling, Braking, and Ride of Road and Race Cars, 3rd ed. Cham, Switzerland: Springer, 2022.
- https://www.dukefsae.com/2024-2025
- Design and validation of an aerodynamic system for a Formula SAE® vehicle using vehicle dynamic simulation and experimentation. (West Virginia University, The University Repository).
- R. N. Jazar, Vehicle Dynamics: Theory and Application, 3rd ed. Cham, Switzerland: Springer, 2025.
- MATLAB SKIDPAD code.
- Ansys, Openfoam, Solidworks, fusion 360, MOTEC.
-
B. Lenzo, ed., Vehicle Dynamics: Fundamentals and Ultimate Trends. Cham, Switzerland: Springer, 2022.