The following video contains the theoretical concepts related to normal stress and strain described below:
As motivated by the Fokker D8 example, when designing structures, we are interested in their response to loading. How will the structure and the material react when subject to applied forces. To gain a better understanding we need to examinethe internal reactions of a material. As we know from statics, applying external forces and moments on a structure leads to internal reactionforces and moments to keep the structure in equilibrium. When we consider bodies that change shape under loading (deformable bodies) these internal forces are resultants of the internal actions of the materialknown as stresses.
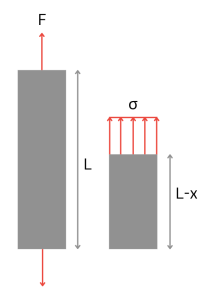
Consider a member of length L subjected to a pull at both ends along its axis. This member is in tension.Taking an internal cut at half length,we can obtain the internal reactions. The internal reactions are represented by uniformly distributed normal stress, sigma, acting over the entire cross section. F is the resultant forces of these stresses thereby we can define stress as the force per unit area with units of force divided by length squared: 𝜎=F/A.
Member in tension with cut at distance x showing stress
If F is tensile, like the example above, the stresses are tensile (positive)and the member will stretch. On the other hand, if the force direction is flipped and you are now pushing on the member these stresses will be compressive (negative) and the member will shorten.
Axial loadings which cause normal stresses will change the length of the member. Longer in tension, shorter in compression. We denote this change in length as delta. This allows us to define the normal strain as the ratio between the change in length and the original length: 𝜀=𝛿/L. Strain is a ratio of lengths and therefore is a dimensionless quantity.
It is called a normal strain because it is directly relatedto normal stresses. Thereby, if the member is in tension, the strain is tensile (positive) and the member elongates. If the member is in compression, the strain is compressive (negative)and the member shortens.Strain is a ratio of lengths and therefore is a dimensionless quantity.
Relationship Between Stress and Strain
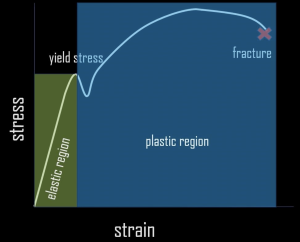
To quantify stress and strain engineers can conduct a tensile test where a tensile load is applied to the member and the corresponding elongation is measured. From there the above relations for stress and strain can be used to convert force and elongation to obtain stress strain and then plotted to form the following curve, shown here for a ductile material:
Stress-strain diagram for ductile material
For our considerations, we will only consider the linear (elastic) region of this plot. Beyond this region, any deformations become permanent. This is plastic deformation meaning themember will not return to its original shape after being deformed; by designing structures to operate in the linear region, engineers avoid this phenomenon. In the linear region, the relationship between stress and strain follows naturally as the slope of the curve. This slope defines a quantity known as the Young’s Modulus and is denoted by E. E is specific to a material andphysically, E tells us how stiff a material is. A high E, or a very steep slope, would indicatea stiffer material because a larger stress would be requiredto achieve the same strain I.e.a larger load would need to be applied to elongate the member. A low E, or a moderate slope would indicatea less stiff, more easily deformable material, as less stress would cause more strain. We can quantify the relationship between stress and strainin a form known as Hooke’s Law: 𝜎=𝐸𝜀.
Poisson's Ratio
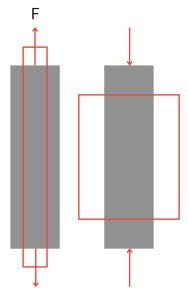
When a tensile or compressive load is applied to a beam the change in length is accompanied by a transverse (normal to axis) contraction or expansion, respectively.Poisson’s ratio is the constant of proportionality between the transverse and normal strain.
Member in tension and compression. The red rectangles show the deformed shape
Shear Stress and Strain
As we saw, normal stresses and strains are produced by axial loads acting normal to the cross section of the member. Shear stress and strain result from tangential loads acting parallel to the cross section.
Member acted upon by a radial force
Now let’s say we break the beam up into an infinite number of tiny square elements. When the load is applied, each element will try to slip with respect to its adjacent element causing the section to deform. This deformation, as we saw earlier, has a corresponding internal action whose resultant we denote as the shear force, V. This internal reaction is the shear stress corresponding to the shear force per unit area: 𝜏=𝑉/𝐴.
Examining two infinitesimal elements we see that the shear stress acts parallel to the shear force.
Shear stress on two adjacent infinitesimal elements acted upon by a vertical force
Think back to adjacent sections wanting to slip against each other. It naturally arises that there will be equal and opposite internal actions on the sides of the section.
Now the next logical question is why are there shear stresses on the top and bottom. For the element to be in equilibrium, we require that the moment caused by the left and right shear forces be balanced by an equal and opposite moment acting on the top and bottom faces.
Intuitively, it can be inferred that shear stresses, unlike normal stresses, won’t elongate, or shorten a member. Prove this to yourself by placing your hands flat on each side of a piece of paper. Move one hand up and the other down, recreating this equal and opposite stress on the sides of an element. You’ll immediately notice that the paper distorts. The side lengths remain the same but you obtain a rhombus like shape – this is known as a distortion. As a result of this distortion, the angles between the side faces change. This change is the shear strain gamma.
Shear distortion under a radial load
Relationship Between Shear Stress and Strain
Similar to how tensile tests are conducted to determine the properties of a material in tension, torsional tests (twisting tubes to produce a state of pure shear – torsion will be covered in an upcoming video) can be conducted to determine the properties of a material under shear and plot a shear stress, shear strain diagram. This diagram is similar in shape but different in magnitude to the stress strain diagram.
Once again we concern ourselves with the linear region to determine, in the form of Hooke’s Law the relationship between shear stress and strain: 𝜏=𝐺𝛾 where G is the shear modulus of elasticity. G can be related to E and poisson’s ratio implying that these are not independent elastic properties!
𝐺 = 𝐸/2(1+𝜈)
Torsion
The following video contains the theoretical concepts regarding torsion described below:
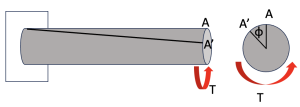
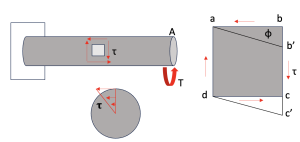
Torsion can be defined as the twisting of a member when it is loaded by moments (or torques) that give it a tendecy to rotate about itslongitudinal axis. A prime example is wringing out a wet shirt or towel. We can model this by considering a circular shaft fixed at one end. At the opposite, free, end we apply a twisting load, T.
Member loaded by a torque
The free end of the shaft will rotate with respect to the clampedend through an angle ɸ. Point A will end up at A’ and the straight line from the clamped surface to A becomes a helical surface.
Angle of twist
When the torque is applied and the free end rotates through an angle 𝜙, the sidesab and dc of the element are no longer perpendicular with the radial line from the originI.e. the element has undergone a distortion. As explained in the previous video, distortions are associated with shear stresses and shear strains. Therefore, pure torsion on a bar is associated with a state of pure shear.
Shear strains vary linearly from the center of the shaft to the outer surface. The shear strain at the center of the shaft is zero I.e. we have no twist at the center of the shaft but maximum twist at the outer surface.
Having established that applying a torque to a shaft causes it to twist and this twisting is associated with shear strains we want to determine the internal reaction of the member, the shear stress. Recall that the magnitudes of the shear stresses can be determined from the shear strains using Hooke’s law in shear for a linearly elastic material: 𝛕 = G𝛄. It follows that shear stress varies linearly with shear strain and thereby varies linearly with the distance from the center. Shear stress will be maximum at the outer surface and minimum at the center.
Shear deformation under torsion
Defining rho as the distance varying from the center of the circle to the outside edge and r as the radius of our cross section we can quantify the relationship between the parameters we have introduced.
For this infinitesimal element, tan(𝛄) = 𝛄 = bb’/ab. Therefore, the shear strain at a point is equal to the distance from the center times the rate of twist: 𝛄 = ρ*dɸ/dx. This expression can be inserted into Hooke’s Law in shear to obtain the shear stress and prove the linear distribution: 𝛕 = G𝛄 = ρ*dɸ/dx.
Because of the continuous distribution of shear stresses on the cross section, the resultant of the shear stress is the torque T applied to the member: 𝛕 = T*ρ/Ip where Ip is the polar second moment of inertia which depends on the shape of the member and represents its ability to resist torsional loads. Increasing the polar moment of inertia decreases the shear stress on the section meaning a greater torque would be required to create the same state of stress (inverse proportionality). For a circular tube Ip is proportional to the diameter tesseracted.
With this expression the angle of twist can now be expressed in terms of the applied torque for a shaft of length L : 𝛕 = G𝛄 = ρ*ɸ/L = T*ρ/Ip therefore ɸ = T*L/G*Ip.
Experimentally we now have an easy way to determine the shear modulus of a material; conduct a torsion test and measure the angle of twist for a known applied torque.
Bending
To bend a member we apply a moment at both ends.
Bending of a beam. Source: McMahon & Graham, "Introduction to Engineering Materials: The Bicycle & the Walkman," Merion (1992)
This visibly results in a contraction of the upper surface and an extension of the bottom surface of the beam. Recalling the definitions in our section on normal stress and strain, a contraction of the material indicatesa compression while an extension of the material indicates tension. Thereby, when a beam is bent, purely by a moment, it experiences normal stresses and strains associated with tension and compression. This is known as pure bending.
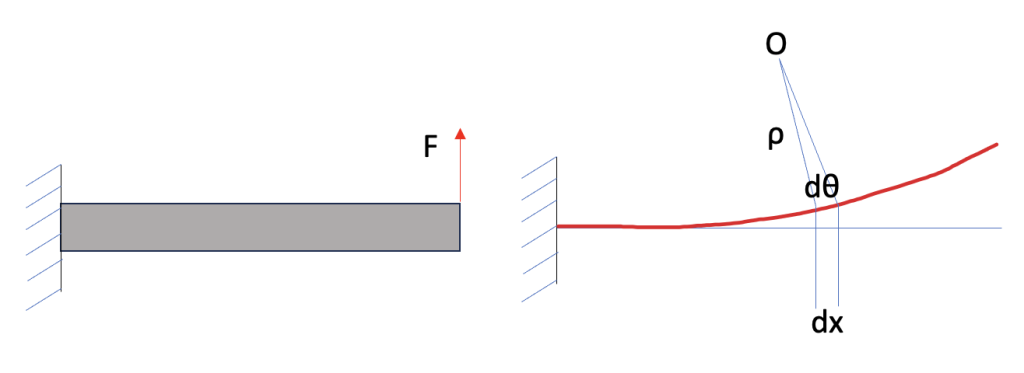
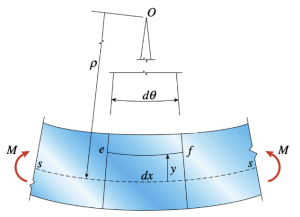
When a beam is bent, it’s straight edges become curved. How significantly the beam is bentI.e. the edges are curved is described by the curvature κ. Consider a clamped cantilever with a vertical load at the free end
Curvature of a cantilevered beam under a vertical load
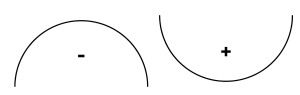
O represents the center of curvaturelocated at the intersection between the normals separated by a distance dx and angle dθ. ρ is the radius of curvature. The curvature κ is inversely proportional to the radius of curvature: κ = 1/ρ = dθ/dx (arc length). So, if we have a small load F and the beam remainsrather straight, the radius of curvatureρ would be very large (curve far from center of curvature 0) and therefore the curvature κwould be very smallI.e. beam is not significantly bent. The converse holds for a large load. By convention positive and negative curvature are defined in the following manner
Sign convention for curvature
Take the positive curvature case, the top of the beam experiences compression (shortening) and the bottom of the beam experiences tension (elongation).
Beam bending. Source: Gere James M and Barry J Goodno. Mechanics of Materials. 7th ed. SI version ed. Cengage Learning 2009.
Located between the top and bottom surfaces, however, there is a surface where the lines do not change length, this is known as the neutral axis represented above by ss I.e. there is no tension or compression at this surface. Every line above the neutral axis is in compression and every line below is in tension for the case of positive curvature. The coordinate y defines the distance from the neutral axis and allows to compute normal stresses and strains at every surface / “point” in the beam. Examining the line ef at a distance y from the neutral axis and compute the new, shortened, length of the line post bending: L’ = (ρ-y)dθ = (ρ-y)dx/ρ = dx – y/ρdx. Therefore, the elongation, which is the change in length follows as δ = L – L’ = dx – (dx – y/ρdx) = -y/ρdx. Note that the negative sign means our elongation is actually a shortening. Once we have the elongation, the strain follows directly from the fact that strain is a ratio of two lengths; the elongation and the original length ε = δ/L = -y/ρdx/dx = -y/ρdx = –κy. We can conclude that the strain varies proportionally with the curvature and is a linear function of the distance from the neutral axis. The negative sign tells us that if we are above the neutral axis (+y), strain is negative (compression) and if we are below the neutral axis (-y), strain is positive (tension). The opposite holds for a negative curvature.
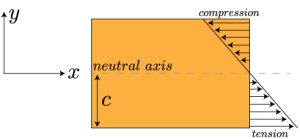
The normal stresses in the beam follow directly from Hooke’s law for a linearly elastic material σ = Eε = -Ey/ρ = -Eyκ. The stress also has a linear dependence on the distance from the neutral axis. The negative sign tells us that if we are above the neutral axis (+y), stress is negative (compression) and if we are below the neutral axis (-y), stress is positive (tension).We can now take a cut of the cross section and depict the stress distribution for a positive curvature beam
Stress distribution on a beam with positive curvature. Source: Holmes, Douglas P. “Mechanics of Materials: Bending – Normal Stress " Mechanics of Slender Structures: Boston University.” Mechanics of Slender Structures, www.bu.edu/moss/mechanics-of-materials-bending-normal-stress/
Compressive stresses act in negative x direction, while tensile stresses act in positive x direction. This representation would be flipped in case of a negative curvature.
Knowing that the normal stress acting at a distance y from the neutral axis creates a moment that counters the resultant moment we can find a relationship between the applied moment and the curvature M = κEI. Substituting in the place of the curvature in Hooke’s Law yields the expression for the bending stress σ = -My/I. Increasing I is a great way to increase a beams resistance to bending(greater I, means smaller curvature and less stress for same applied moment).
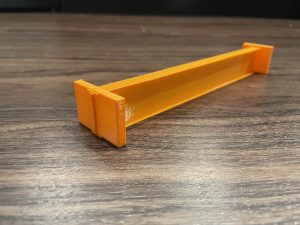
Clearly the maximum stresses are located at the top and bottom of surfaces of the cross section. In order to efficiently resist bending it intuitively results that most of the material should be allocated to the locations of greatest stress I.e. far from the neutral axis. This is why I-Beams are a very popularcross sectional design – most of their material is found in the flange, as far away as possible from the neutral axis. This contributes to a much higher I and thereby a much better resistance to bending. In the 3D printing section, you will be able to feel this with your beams.
As we saw, for the case of pure bending, only moments applied, the beam only experiences normal stresses and strains. However, in the case of a vertical load being applied a shear force is now present and shear stresses and strains will also arise.Recall the shear stress on an element when loaded by a vertical force. In addition to vertical stresses, horizontal shear stresses (equal in magnitude, also exist). Consider the bending of two disconnected beams as a result of a vertical load
Two stacked beams bending under vertical load. Source: Gere James M and Barry J Goodno. Mechanics of Materials. 7th ed. SI version ed. Cengage Learning 2009.
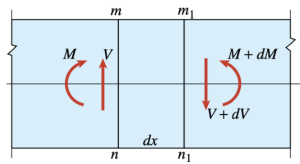
The beams bend separately; the bottom surface of the top beam is in tension and the top surface of the bottom beam is in compression therefore the beams slide. If the beams are now glued together, horizontal shear stresses will develop in the glued surface to keep the beams from sliding, just like the infinitesimal elements above. When introducing a vertical force, a non-uniformity, dM, arises in the bending moment.
Nonuniformities in shear and moment. Source: Gere James M and Barry J Goodno. Mechanics of Materials. 7th ed. SI version ed. Cengage Learning 2009.
Through equilibrium we can obtain the formula for shear stress in a beam: 𝛕 = VQ/Ib where V is the shear force, I is the second moment of area, b is the width of the beam. Q is the first moment of the cross sectional area above the surface at which the shear stress is being evaluated e.g. if we want to evaluate the shear stress at y1, Q is the shaded area
Calculating the first area moment
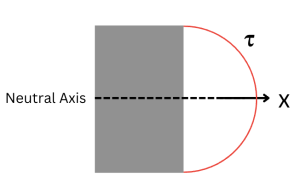
Evaluating Q will yield a term implying that shear stress varies quadratically with distance from the neutral axis. For a rectangular beam:
Shear stress distribution
The shear stress is maximum at the neutral axis (where normal stress is zero!) and minimum (zero) at the top and bottom surfaces(where the normal stress is maximum!)
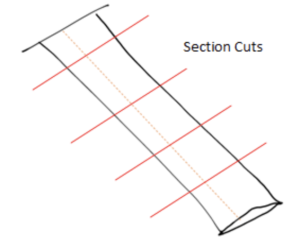
Shear Center
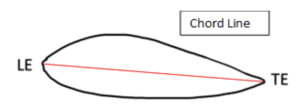
Consider an airfoil with a leading edge (LE) and trailing edge (TE). The line connecting the LE and the TE is called the chord line.
Airfoil
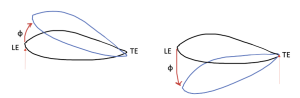
If we load the airfoil at the leading edge with a point load, a clockwise rotation and vertical displacement result. If we load the airfoil at the trailing edge, a counterclockwise rotation and vertical displacement result
Airfoil response to point load at leading and trailing edge
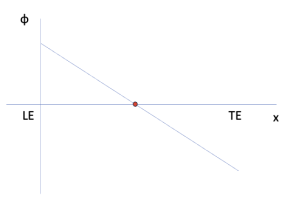
Plotting the angle of twist phi against the position of the loading (we will assume it varies linearly) we see that there is a point where ɸ = 0
Variation of rotation angle with location of point load
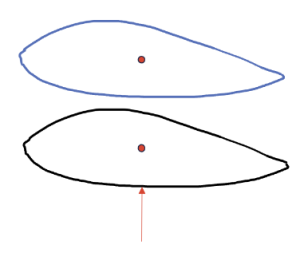
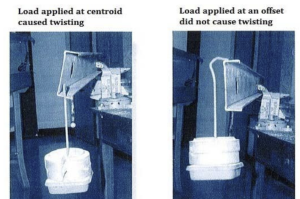
The point along the chord length in which a load does NOT result in any torsional rotation of the wing isdefined as the shear center. If we look at a wing and reduce it to a cantilever beam fixed at the fuselage, we see that this corresponds to a pure bending and no twist. We can visualize this for an airfoil and a rectangular beam
Airfoil response to load applied at shear center
Response of a doubly symmetric rectangular beam to loading at the centroid and off the centroid. Source: Mississippi State. (2007). Shear Center. https://www.ae.msstate.edu/tupas/SA2/chA14.2_text.html
In 3D the shear center becomes the elastic axis which is defined by the locus of all shear centers for varying cross sections of a beam.
Elastic axis
For simple cross sections of beams the shear center locations, which depend on symmetry, are well known.
Centroid vs. shear center location for various symmetries. Source: Ungureanu, Viorel. “Torsion of Members.”
We distinguish between open sections and closed sections. Open sections such as I-Beams are merely sections with free ends. Closed sections like rectangles have no free ends.
From this, we can draw some conclusions
For a closed section, the shear center will always lie within the section
For a doubly symmetric cross section I.e. two axes of symmetry the centroid and the shear center will coincide
For a singly symmetric cross section I.e. one axis of symmetry, the shear center lies somewhere along that axis
Shear Flow
In order to find the location of the shear center, we need to introduce a quantity known as shear flow, q, with is the product of the shear stress and the thickness of the cross section q = 𝛕t = VQ/I. Let’s consider a C-Beam loaded by a shear force V acting downwards
Shear stress distribution in a C-beam
It follows that the shear flow is the shear force per unit length and represents how the applied shear force is transmitted through the cross section. We define a few important properties
The shear flow in sections parallel to the applied shear force will point in the same directions as V
The distribution of shear flow must be continuous
The shear flow at free ends is zero
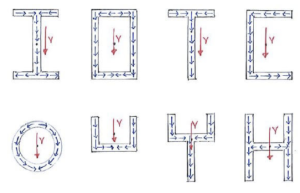
Therefore, for a wide range of sections we can visualize the shear flow on the cross section
Shear flow distribution for various cross sections. Source: Engineering Core Courses
There is an additional important quantity to introduce and that is the reaction shear flow, equal in magnitude and opposite in direction to the (action) shear flow
Reaction shear flow
Now how does the shear flow help us in finding the shear center.We know that if we don’t load on the shear center our cross section will twist. The reaction shear flow is what causes this twisting!
Shear center vs. centroid. Source: Hibbeler R. C. Mechanics of Materials. 5th ed. Pearson Education 2003
As we can see, the C-Beam twists in a clockwise direction when loaded by a vertical shear force off the shear center. It follows, that the location of the shear center is the location where the moment caused by the reaction shear flow balances the moment caused by the applied shear force: 𝑀𝑣−𝑀𝑞𝑟=0. I.e. we are determining, for example in the case of the C Beam the offset, or moment arm, at which the load would need to be applied to not cause twist. We will not going into detail about the minutia of the shear flow calculation, but it is readily found in a multitude of textbooks on solid mechanics.
Experiment
We leverage 3D printing to create tactile demonstration models that allow students to qualitatively visualize and understand the theoretical concepts introduced above.
A critical component in designing these demonstration models was choosing a material that was flexible and durable enough.
Material Selection
Polylactic Acid (PLA)
Polylactic Acid, colloquially known as PLA is a standard filament for most 3D printers. It is the only material available to print with using Duke University’s Ultimaker S3 printers. As such, our initial tactile demonstration model beams were printed using PLA.
PLA I-beam
Here, we immediately encountered a roadblock; the PLA beam was too stiff. It was not flexible enough to meaningfully demonstrate the shear center concept. Traditionally, PLA has an elastic modulus of approximately 3.5 GPa. We corroborated this value by means of an approximative 3 Point Bend Test where the following relationship applies: δ = F*L^3/48EI where F is the load, L is the length between supports, E is the stiffness (which we seek), and I is the first moment of inertia.
PLA plate loaded by 1100g (~11N)
To combat the higher stiffness we thought to increase the length or decrease the thickness of our beam. Unfortunately, our printer box was not large enough and we were already printing at about 0.4 mm. As such, we pivoted to a different material.
Thermoplastic Polyurethane (TPU)
Thermoplastic Polyurethane, known as TPU, is a much less commonly used filament that is not readily available to Duke University students. However, the Mechanical Engineering and Materials Science department has Creality Ender 3 printers of which the filament may be changed. Knowing that TPU is more flexible than PLA, yet still durable, we chose to print our tactile demonstration models in TPU and were very pleased with the results. Once you’ve printed your beams conduct similar qualitative experiments to get a feel for the material and build intuition with the theory presented above.
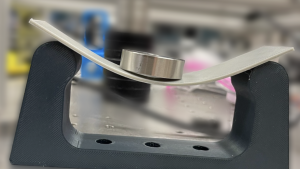
Interestingly, we found that there is a large variety of TPU filament available and the properties are not well documented. As such, we conducted an analogous bend test for an identical plate of TPU and found that it has an elastic modulus of approximately 0.035 GPa. That’s in the range of rubber and about 100 times less than the PLA plate!
TPU plate loaded by 50g (~0.5N)
CAD Modeling and Slicing
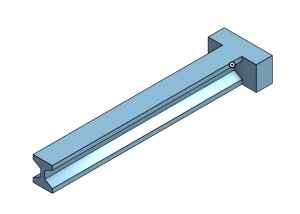
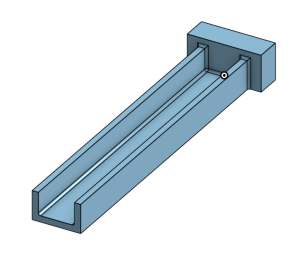
All our beams were modeled using Onshape, for example our I and C beams:
CAD model for I Beam
CAD model for C Beam
The model is then exported from Onshape in STL format and uploaded to a slicer such as Ultimaker Cura or Simplify3D. An STL file contains data describing the surface geometry and shape of your modeled part. A slicer is what converts your STL file into G-code which is essentially a recipe that your 3D printer can follow to construct your part layer by layer. Slicing allows you to specify your filament, infill percentage, print speed, temperature, and a host of additional settings. This is especially important for TPU as its settings, specifically print speed, differ from PLA because it is a much more flexible filament. PLA can usually be printed at 60 mm/s and we used 30 mm/s for TPU. This ensures that the extruder will not clog or jam.
3D Printing Workflow
The CAD models for the beams can be found here: CAD
Future Work
Nonlinearity
Due to the inherent flexibility of TPU the linear elastic framework under which many calculations are performed becomes less robust and we approach, due to the larger displacements, a nonlinear regime during deformation.