
Author: Zhan Wu
Partner: Xin Zhang
Civil War Washington DH Project URL: www.civilwardc.org
The following is a critique that will evaluate a DH project about various aspects of the Civil War in Washington. The critique will be using Shannon Christine Mattern’s “Evaluating Multimodal Work” [1] as a reference in establishing various evaluation standards.
To start off, one of the most evident things in this DH website project is the overall structure, which is visually very clear. The project utilizes “tiles” in its front page. Each tile is comprised of a title and a short overall description about what the reader can expect when opening the tile URL. Every tile also contains a picture within it so that navigation around the website becomes visually easier. There are more choices that the reader can select when opening specific tiles on the front page. Opening the “Data” tile, for example, will guide the reader to different, more specific subsections, such as People, Places, Events, Organizations etc. Clicking in turn on one of the subsection links will lead the reader to even more concrete contents in the web page.

Tiles on the Front Page
Subsections of the “Data” Tile
The entire structure can be thought as a tree chart whereas one option engenders more options, which in turn give even more options and so on. This kind of structure is advantageous to scholars who intend to research on very specific facts about the Civil War in Washington without having to cram through unnecessary chunks of information. This also implies that the delivery system of the subject matter is very robust, meaning that the people making this project presented their information on the best possible platform-a website. A website enables random access to information, which is an advantage over media that use linear presentation of information, such as a paper.
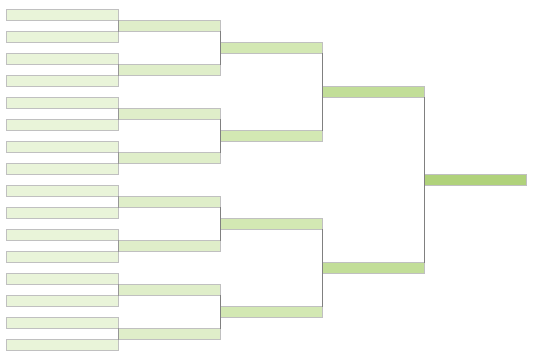
Illustration of a Tree Chart.
The project uses tables, maps and pictures as its main media formats. Tables are generally utilized in the Data section and are there to list specific people, places and events related to the time. The use of tables in the DH project makes browsing through the information significantly easier. For instance, if the reader wanted to do research on the 3rd Division Hospital in DC during the Civil War, he/she would just need to go Data-Places, where there is a comprehensive list of important locations, and simply look up “3rd Division Hospital”. Search options are available and are a great add-on to the website if under any circumstances the desired content cannot be found by browsing visually through the lists and tables.
Maps are yet another media format and are a great feature on the website. There is a thorough description on how to use the map right under the Map section of the website. It sufficiently documents the specific functions of the menu bar and the search feature, and shows the reader how to navigate throughout the map (zooming in/out, changing layers, inserting more maps etc). There are symbols on the map that show various hospitals, churches, petition events and houses/apartments of renowned people at that time. One can also change map layers, which essentially gives the reader the option to either use a Washington map made during the Civil War or a contemporary DC map for the purpose of their research.
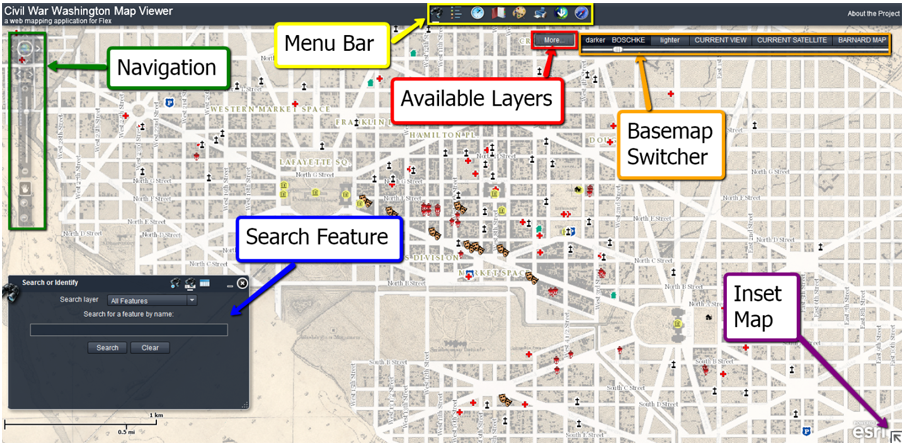
Part of the Visual Tutorial of the Map of in the Project.
A downside of the project might be that the website only includes traditional media expression tools like tables and pictures, but fails to incorporate more contemporary media formats, such as videos, plots, or mathematical charts. Granted, the project encompasses an online map that can be manipulated to a vast extent (described above), but those “traditional scholarly gestures” (Mattern n.d.) still far outweigh modern media formats. Therefore, adding more of said media would greatly increase the value, gravity and reliability of the information presented.
The data in this DH project is very much contextualized. Every piece of data, when opened, is automatically related to another most relevant data piece. This is most evident in the Data section. If the reader searches for a specific person, he will immediately be informed about the places, organization and events related to that person. The most relevant information is often provided in URL links to give the reader the opportunity to do further research on that aspect. Clicking on the “Abbott Thomas” link in the People section, for instance, the reader will be furnished with the most relevant information such as gender (male), race (European American), occupation (clerk), status (independent free) as well as places (1st Division Hospital) and organizations (101st New York Infantry) related to Thomas. These interconnections of data reflect to a certain extent that the participants of the project made controlled and deliberate decisions of the technology (in this case the website and URLs) they were using and also tells us that the information presented is not fabricated but strongly related to the context of the Civil War.
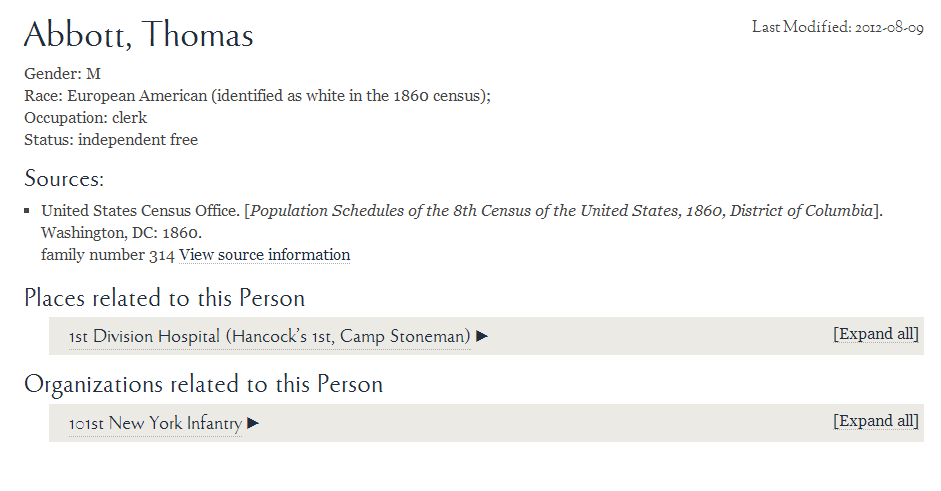
Interconnection of People, Organizations and Places in the Project.
Furthermore, the project itself has an “About” page and a FAQ section which document how the participants in this project created the website, how research into the subject matter was funded and what educational institutions were mainly contributing to the research and documentation of the data in the project. The web page creators have also paid meticulous attention to separating these kinds of information (About, FAQ, Participants etc.) from the actual research documentation (People Events, Organizations of DC during the Civil War) by putting the links of the former at the lowest part of the web page with a different background color, clearly separating the two parts.
Almost all of the participants that contributed to the formation of this project are consultants, research associates and research assistants, with only minor numbers of graduate students and no undergraduate students. It is regrettable that this project did not employ more student participation, however this doesn’t mean that the historical information provided by the project is only targeted for a strictly professional audience. In fact, kudos should be given to the creators for attempting to address one of the most important events in US history with documentations that are not only accessible to professional scholars, but also easily readable by a wide audience, including students and even amateurs. Additionally, the whole project is a good model for future project directors to refer to when developing their own project.
Last but not least, the project gives credit where credit is due. Every citation is appropriate and contains several URLs to the source where the information was gleaned. Credits and full descriptions of all the collaborators are also presented in the “Participants” section of the website. The website link www.civilwardc.org itself is an extremely straightforward link and provides other authors easier ways of citing the materials presented in the project.
In conclusion, I believe that the project is well established, sufficiently researched and annotated and shows numerous signs of the authors exercising control over their web page technologies. The project will surely stand out if those minor drawbacks mentioned above can be amended and remodeled.
Sources:
[1] Mattern Shannon C..Evaluating Multimodal Work, Revisited.
http://journalofdigitalhumanities.org/1-4/evaluating-multimodal-work-revisited-by-shannon-mattern/