Context:
Coal taxes were passed in 1667 and 1670 to help pay for the reconstruction of London after the Great Fire of 1666. Backlash against coal dues took place from 1687 to 1697 given that there were to be two more decades of coal taxes being distributed to the already expensive project.
Our Focus:
- How did the upper/ruling class respond to the backlash against coal taxes?
- How does this reflect the relationship between the upper and lower classes?
- How is this reflected in architectural structures, like St Paul’s Cathedral?
Methodology:
Sentiment Analysis
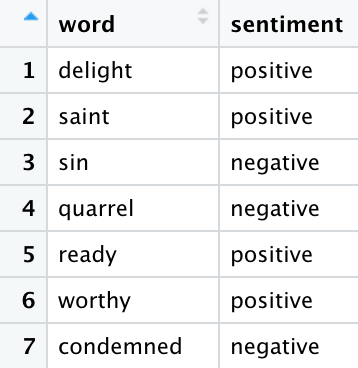
Sentiment analysis is the use of natural processing language (NPL) and text analytics to extract and quantify emotion and subjective information. We used the BING dataset to assign sentiment values to words within our text. It assigns a value of +1 for words that have positive sentiment and a value of -1. for words that have negative sentiment. We calculated the positive sentiment of our texts by using the equation: positive/total sentiment.
Word Embedding and Cosine Similarity
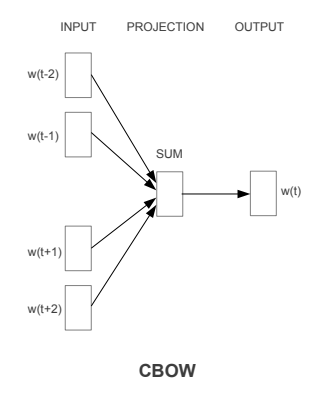
We used Word2Vec to perform word embedding on our text. Word2Vec represents words as vectors based on several features, such as window size and vector dimensions. Similar words tend to have the same vector values and are grouped in the same block.
The method we used to calculate vector values was Continuous Bag of Words (CBOW), where surrounding words are combined to predict the word in the middle.
After assigning a vector to each word, we performed cosine similarity between 2 different words. Cosine similarity is the calculation of the similarity between two n-dimensional vectors by looking for a cosine value from the angle between the two. A cosine similarity of +1 means that two words are perfectly correlated, 0 means that they are not correlated, and -1 means that they are strongly opposite.

Analysis:
Conclusions:
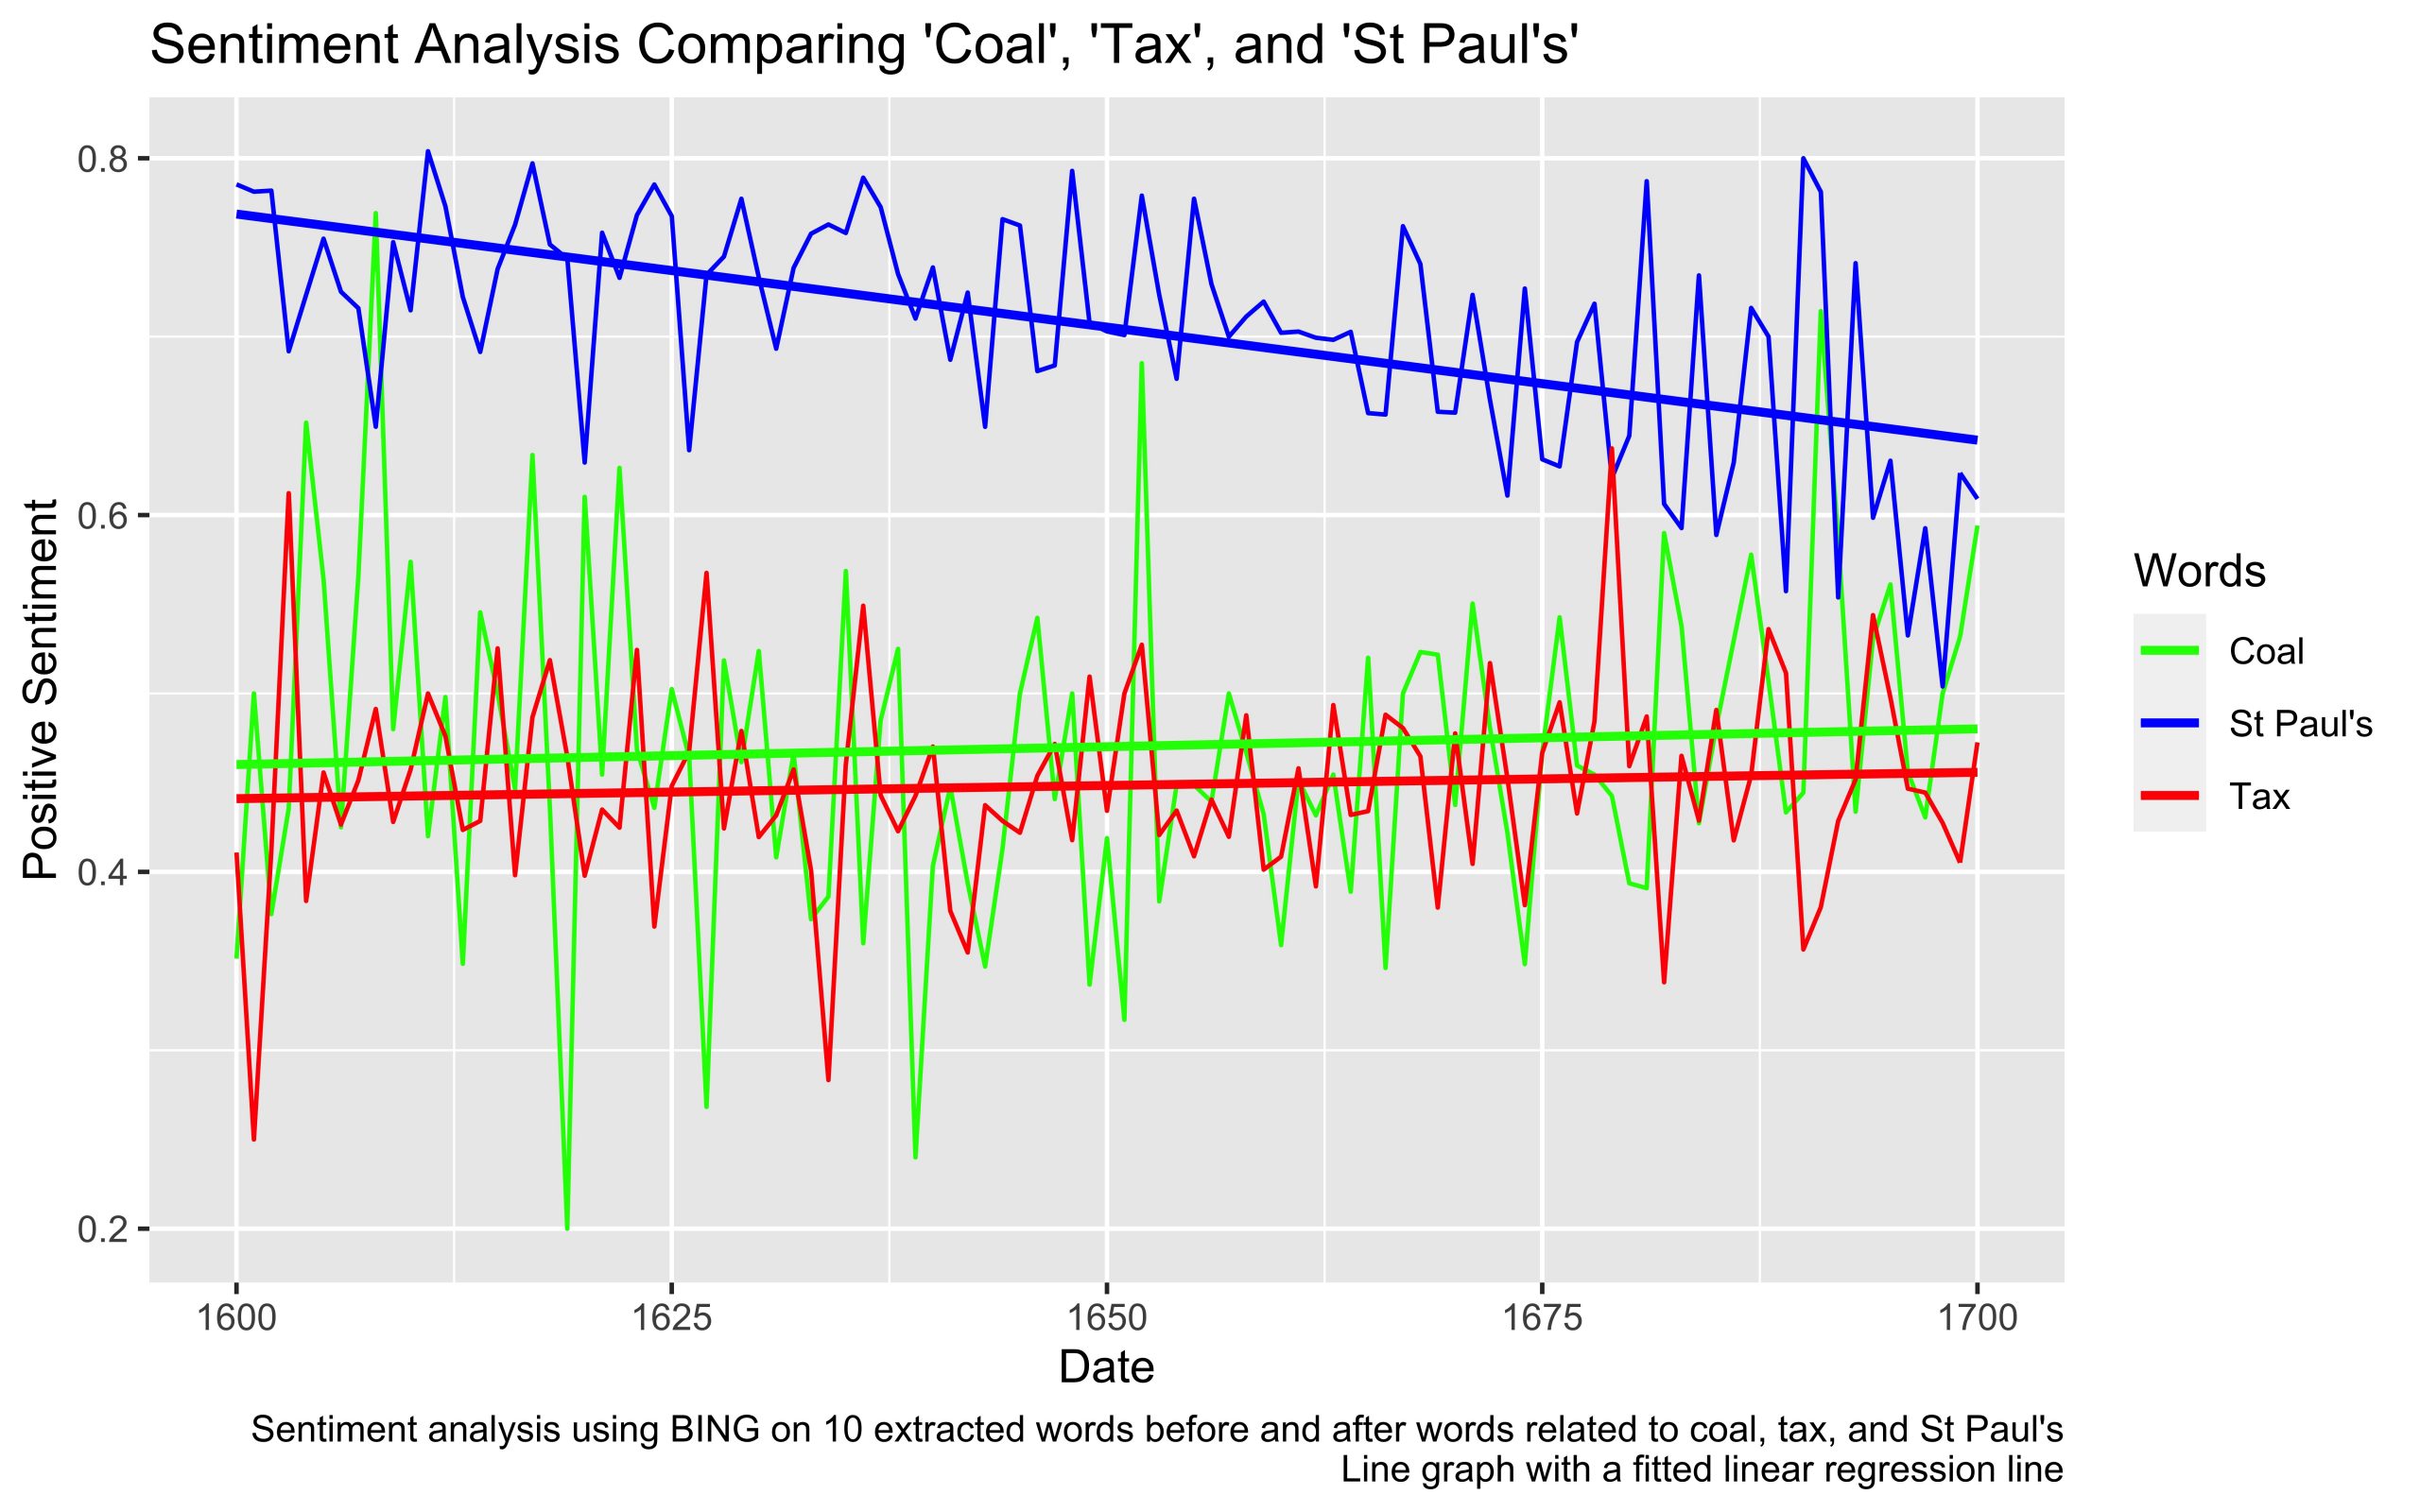
Here, the positive sentiment for St Paul’s Cathedral decreases throughout the century but generally remains higher than both coal and tax. When looking at the line graph, the positive sentiment for St Paul’s doesn’t have a significant decrease until the second half of the century, implying that the fire and its reconstruction might have generated backlash, possibly due to coal taxes.
When looking at the fitted linear regression lines for both coal and tax, there is a slight increase throughout the century. Between the years 1675 to 1700, there are instances when the line graph for both coal and tax indicate a similar positive sentiment with St Paul’s. These things could indicate that writers started depicting coal and tax in a more positive manner in response to backlash against coal taxes to convince people that good could be done with the collected taxes.
Conclusions:
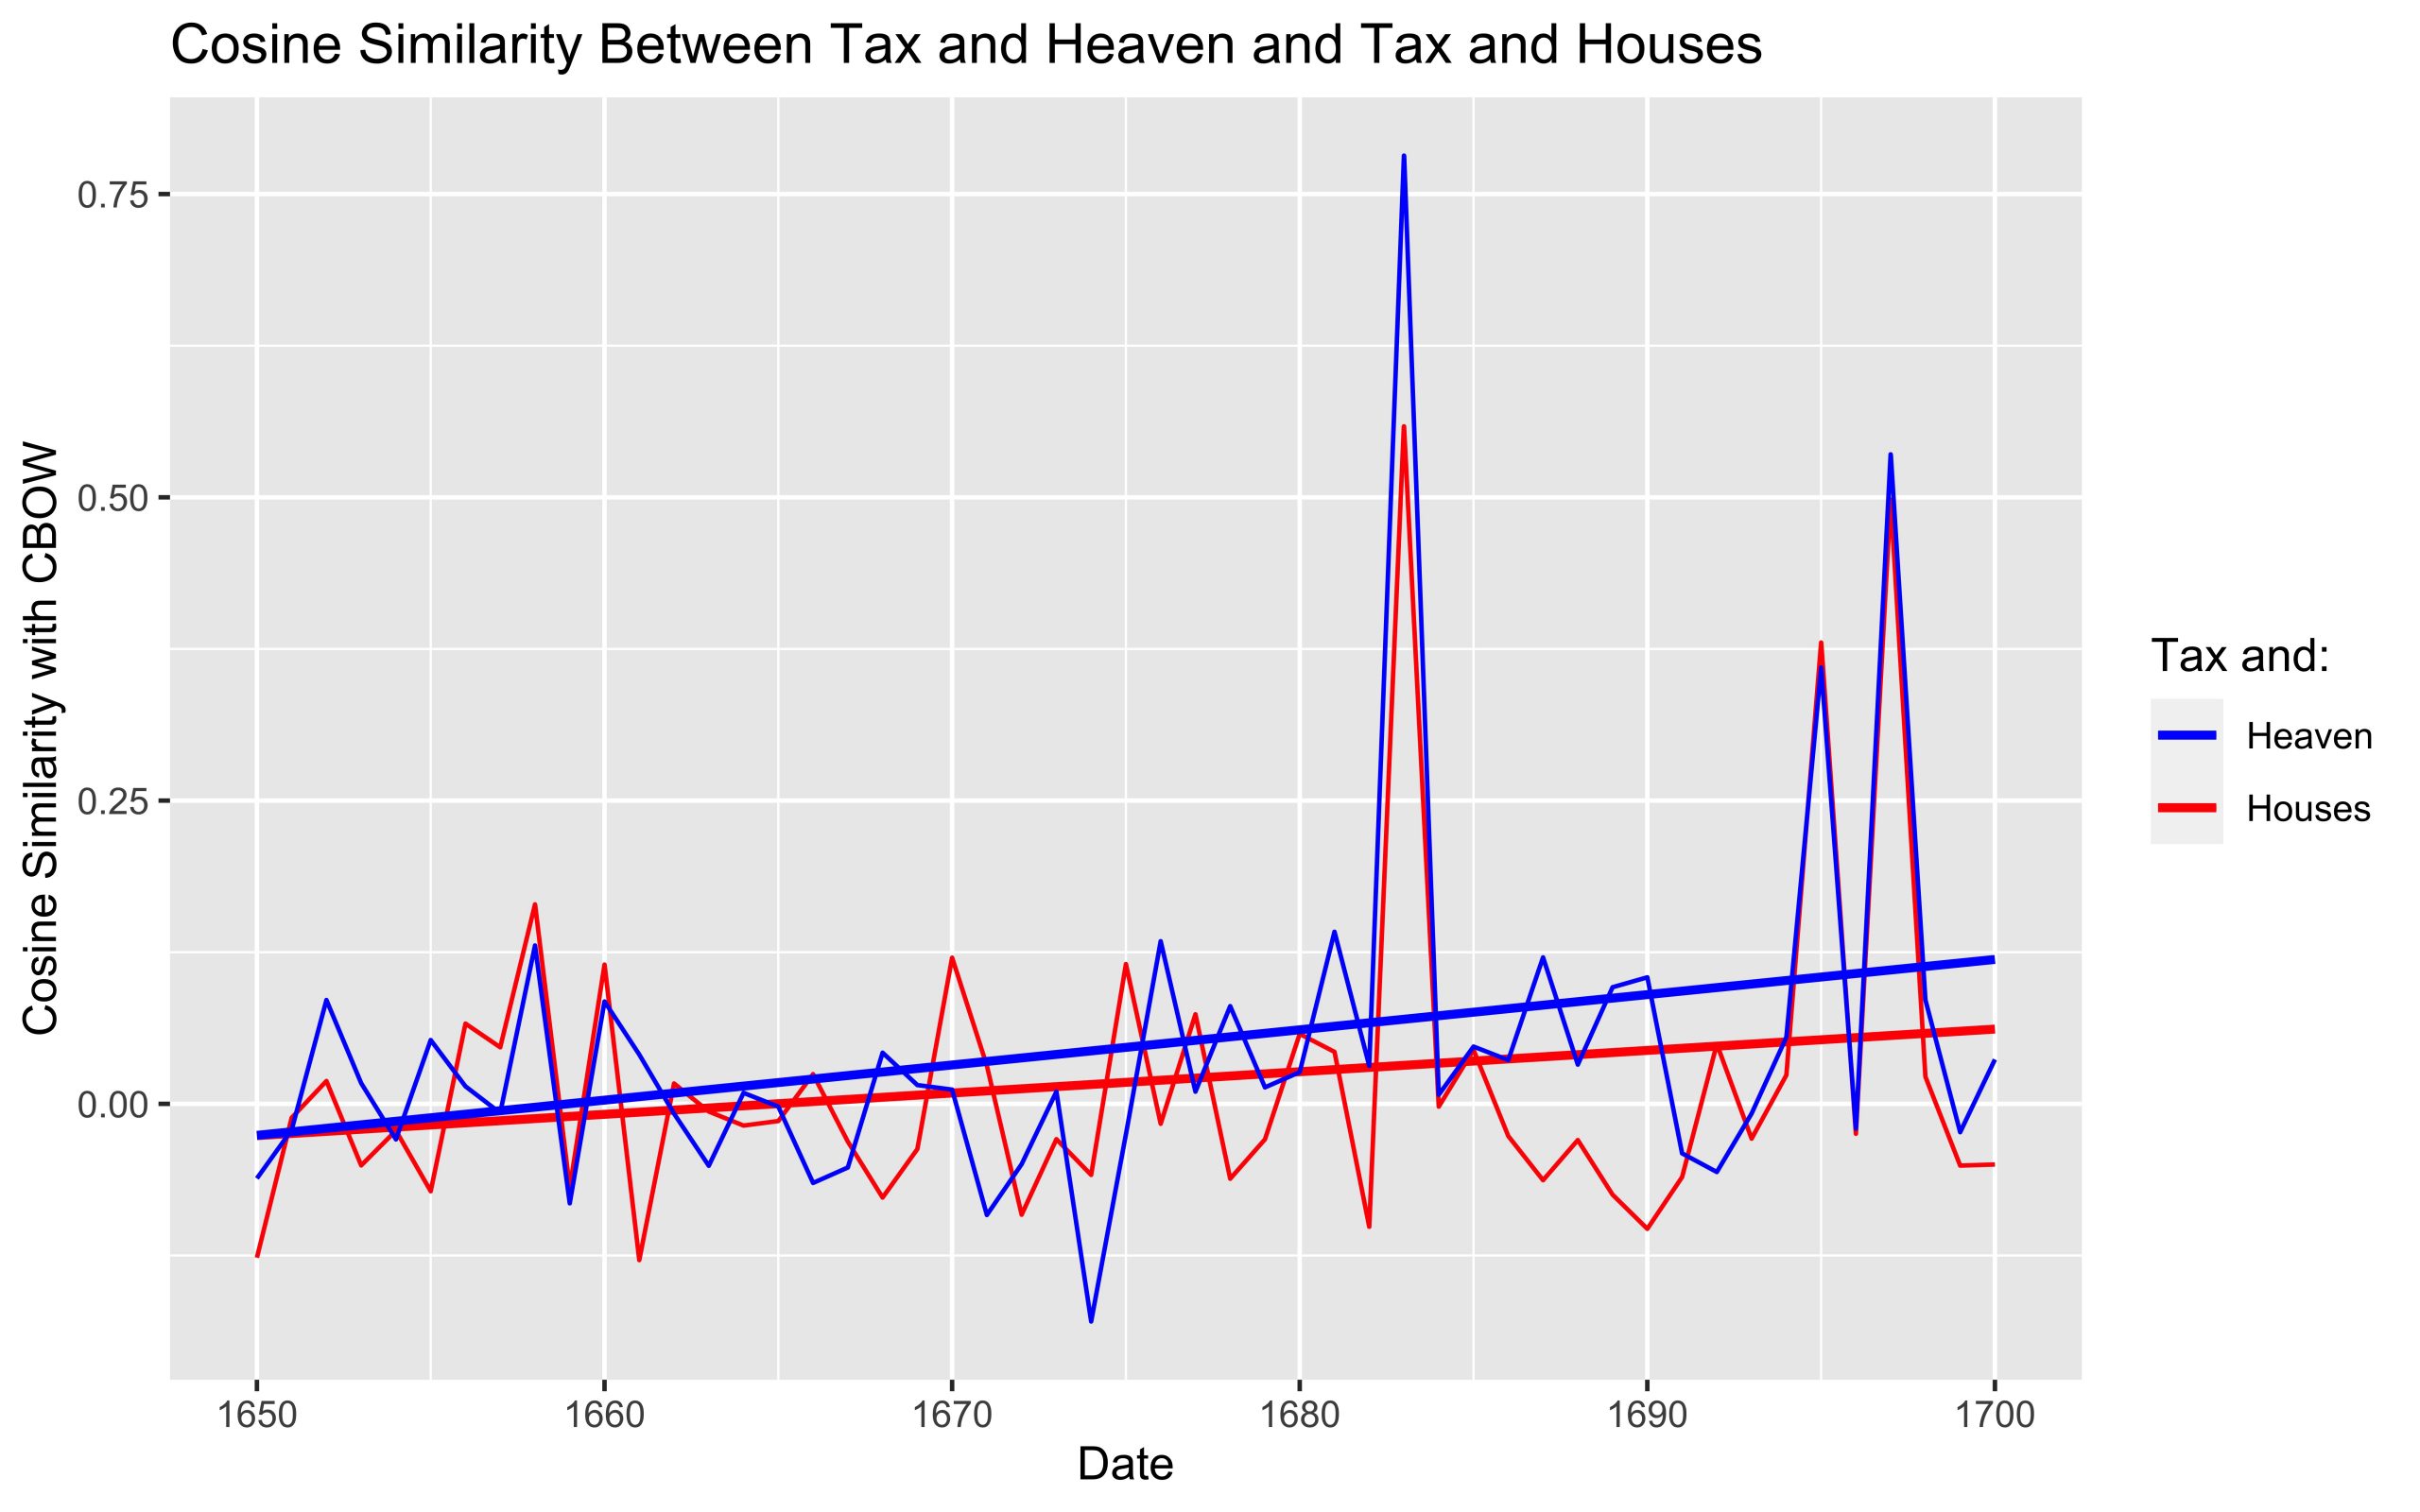
Here, this graph is showing the cosine similarity between tax and heaven and tax and houses. It is possible that the increase in cosine similarity between tax and houses throughout the 17th century is because the coal taxes that were collected were used to build buildings or houses, highlighting the practical usage of coal taxes. The increase in cosine similarity between tax and heaven could indicate that taxes were being portrayed as being used for the greater good or higher purpose. The intent behind this association could be in response to backlash from common people who viewed taxes as a burden and to remind them that their actions serve an other-worldly purpose. Here, in literature, writers are expressing both a pragmatic reason and a spiritual reason behind the collection of coal taxes.