Category Archives: Testing

AL2S Network Setup and Testing Summary

In an earlier post I described the setup of the new v3.4 perfSONAR node used to test the AL2S network.  In this post I will summarize the results of the 1 week test done on the AL2S link to UChicago along with a description of the work that Victor did to setup the link.

Setup

The TelCom Arista has a PerfSonar box connected to it, on port 17.
The TelCom Arista *also* has a connection to AL2S, via MCNC, that arrives via port 1.
We share the connection through AL2S with RENCI, and RENCI has allocated us 100 VLAN tags to use (1000-1099, inclusive).

Last week, Victor allocated a 5 Gbps circuit for testing between Duke and Chicago.
It is using VLAN tag 1000 (on our end), and expired at 4 PM on Monday (10/20/14).
AL2S performs a tag flip somewhere in the link, so that our VLAN tag 1000 becomes VLAN tag 3000 at Chicago’s end.

The first thing we did was to test in traditional switch mode.
This meant:
1) Allocating VLAN 1000 on the TelCom Arista
2) Ensuring that port 1 was in trunk mode, and that tags 1000-1099 were allowed
3) Ensuring that port 17 was in access mode for tag 1000
4) Setting up a VLAN interface for tag 1000

We agreed with Chicago to use the private subnet 192.168.10.0/24 for testing.
The VLAN interface on the TelCom Arista was configured to use address 192.168.10.2; the Chicago switch was configured to use 192.168.10.1.
After confirming connectivity between the switches, the PerfSonar boxes at each end were configured with addresses 192.168.10.3 (Duke) and 192.168.10.4 (Chicago).

Once we had done a bit of testing in traditional switch mode, we chose to test the OpenFlow capability, using rest_router.
To set this up, Victor did the following:
1) Add port 1 to the OpenFlow instance on the TelCom Arista
2) Add port 17 to the OpenFlow instance on the TelCom Arista
3) Configure port 17 into trunk mode on the TelCom Arista; ports in access mode do not function in OpenFlow mode
4) Add a vlan tagged interface to the PerfSonar box hanging off port 17; this was accomplished thus:
a) ifconfig p2p1 0.0.0.0
b) modprobe 8021q
c) vconfig add p2p1 1000
d) ifconfig p2p1.1000 192.168.10.3 netmask 255.255.255.0 up mtu 9000
5) Add the private address range to rest_router’s management using curl, thus:
curl -X POST -d ‘{“address”:”192.168.10.254/24″}’ http://sdn-prod-01.oit.duke.edu:8080/router/0000001c7365b107/1000

At this point, packets were being switched onto the AL2S link, within the TelCom Arista, using OpenFlow rules.

Since roughly Tuesday afternoon, perfSonar running measurements against the peer perfSonar box at Chicago.
The bandwidth data has been pretty noisy, both with traditional switching and with OpenFlow.
We expect that there’s some bandwidth contention; and would be curious to see how the results look with bwctl being run in parallel mode within the web interface.
When bwctl is run manually (and explicitly specify the degree of parallelism), we get fairly consistent (and high) results that exceed the requested bandwidth of the link (typically very close to 10 Gbps –

Command Line BWCTL Results:

[root@tel-perfsonar-01 ~]# bwctl -c 192.168.10.4 -P8
bwctl: Using tool: iperf
bwctl: 36 seconds until test results available
RECEIVER START
------------------------------------------------------------
Server listening on TCP port 5239
Binding to local address 192.168.10.4
TCP window size: 87380 Byte (default)
------------------------------------------------------------
[ 15] local 192.168.10.4 port 5239 connected with 192.168.10.3 port 57265
[ 17] local 192.168.10.4 port 5239 connected with 192.168.10.3 port 49730
[ 16] local 192.168.10.4 port 5239 connected with 192.168.10.3 port 58667
[ 18] local 192.168.10.4 port 5239 connected with 192.168.10.3 port 53343
[ 19] local 192.168.10.4 port 5239 connected with 192.168.10.3 port 41485
[ 20] local 192.168.10.4 port 5239 connected with 192.168.10.3 port 55678
[ 21] local 192.168.10.4 port 5239 connected with 192.168.10.3 port 39032
[ 22] local 192.168.10.4 port 5239 connected with 192.168.10.3 port 39575

[ ID] Interval       Transfer     Bandwidth

[ 22]  0.0-10.0 sec  3123445760 Bytes  2488803881 bits/sec
[ 22] MSS size 8948 bytes (MTU 8988 bytes, unknown interface)
[ 17]  0.0-10.1 sec  1780350976 Bytes  1413963232 bits/sec
[ 17] MSS size 8948 bytes (MTU 8988 bytes, unknown interface)
[ 15]  0.0-10.1 sec  1054474240 Bytes  832376766 bits/sec
[ 15] MSS size 8948 bytes (MTU 8988 bytes, unknown interface)
[ 21]  0.0-10.1 sec  1462370304 Bytes  1154438086 bits/sec
[ 21] MSS size 8948 bytes (MTU 8988 bytes, unknown interface)
[ 18]  0.0-10.2 sec  1421213696 Bytes  1117543689 bits/sec
[ 18] MSS size 8948 bytes (MTU 8988 bytes, unknown interface)
[ 20]  0.0-10.2 sec  1135476736 Bytes  890163568 bits/sec
[ 20] MSS size 8948 bytes (MTU 8988 bytes, unknown interface)
[ 16]  0.0-10.2 sec  858259456 Bytes  672128900 bits/sec
[ 16] MSS size 8948 bytes (MTU 8988 bytes, unknown interface)
[ 19]  0.0-10.2 sec  930742272 Bytes  727474666 bits/sec
[ 19] MSS size 8948 bytes (MTU 8988 bytes, unknown interface)
[SUM]  0.0-10.2 sec  11766333440 Bytes  9196648461 bits/sec

Wed Oct 15 14:06:26 EDT 2014

Which shows about 9.2 Gbps which is great.

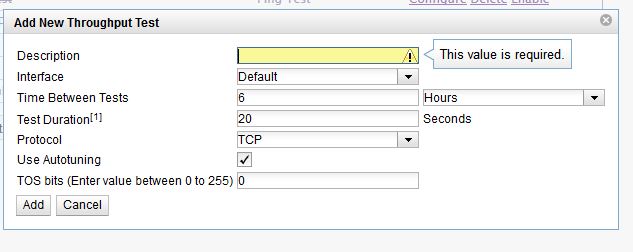
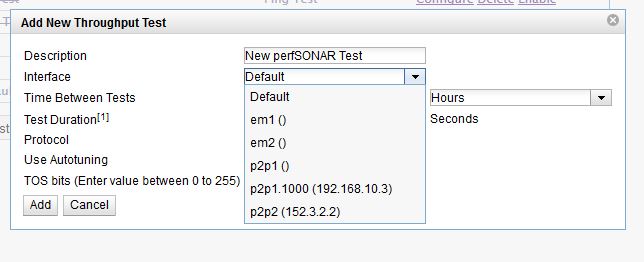
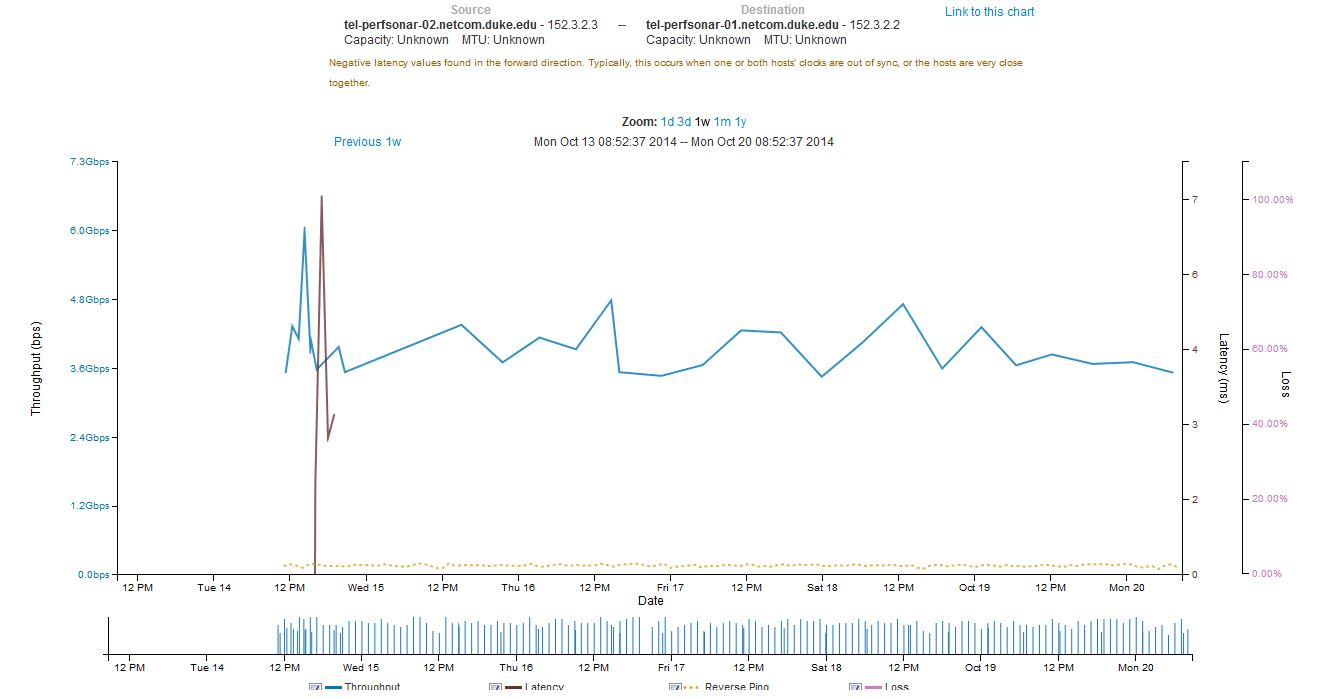
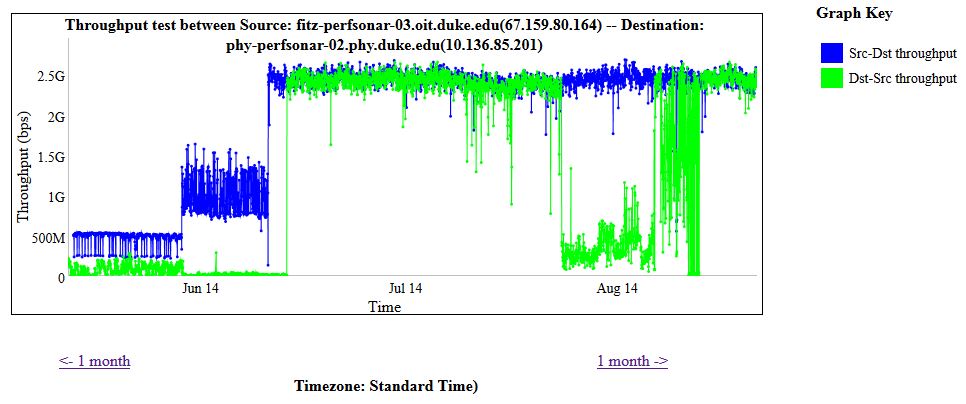
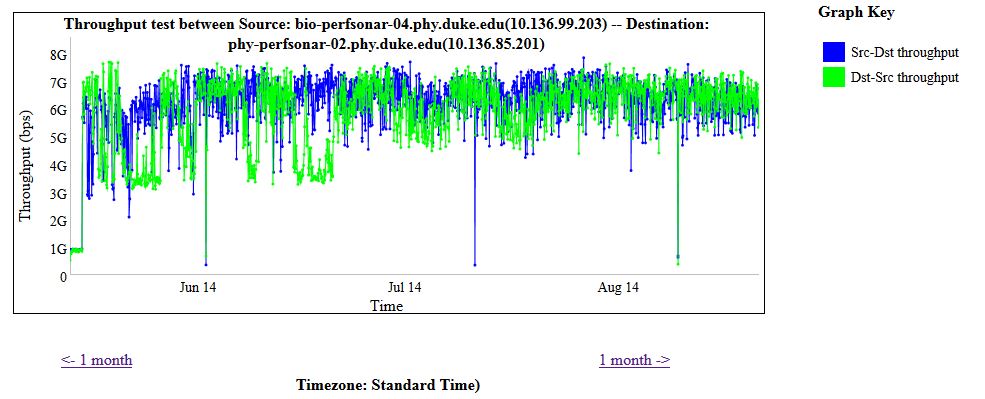
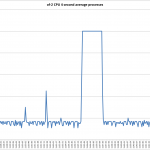
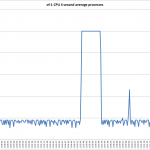
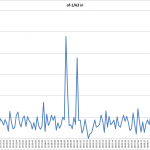
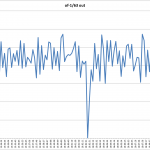
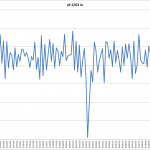
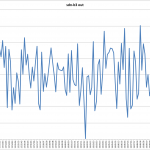
The full results for the bandwidth testing using the perfSONAR GUI is shown below:

perfSONAR results - tel-perfsonar-01 to 192-168-10-4 (Chicago) - 2014-10-21 - Final - Full Week

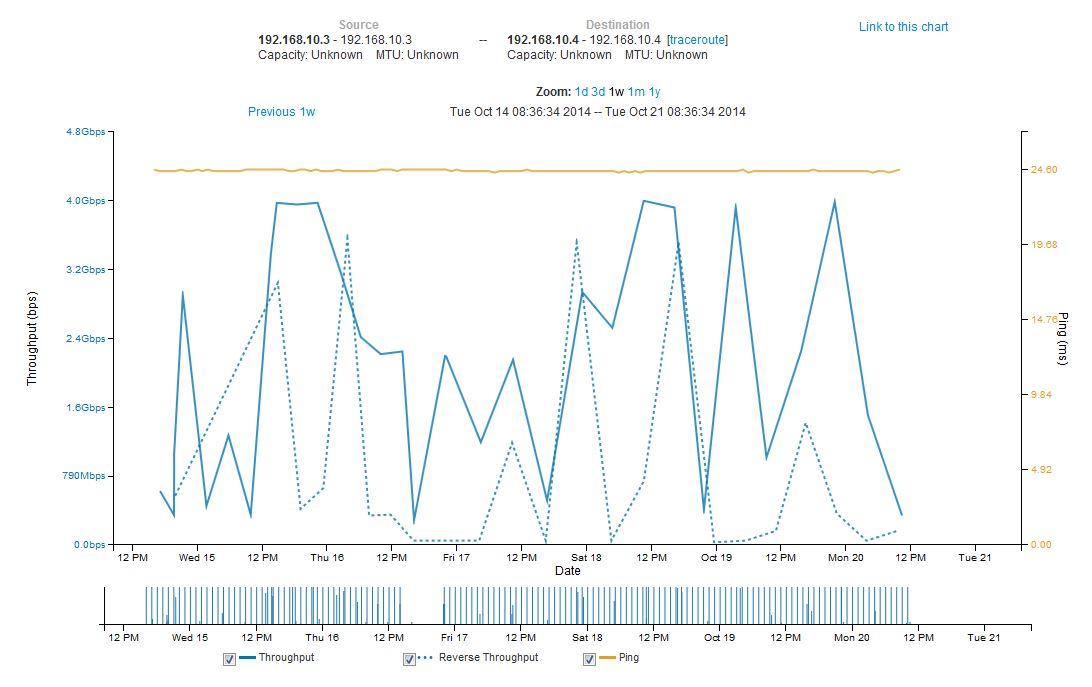
A couple of items to note –

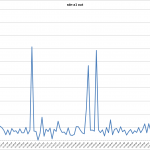
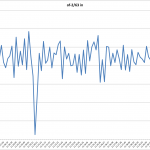
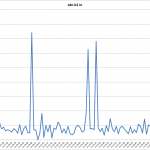
  1. General variation of the bandwidth – inbound and outbound bandwidth over the link to the UChicago perfSONAR node varied broadly.
  2. Consistency of ping times – the ping times from tel-perfsonar-01 (192.168.10.3) to the UChicago node (192.168.10.4) where rock solid at 24.6 msec and did not vary when the Arista switch was in normal mode vs. OpenFlow mode.
  3. The lack of data between 4PM and 10 PM on Thursday 10/16/14 was due to Charley incorrectly setting the IP address on the primary network interface (p2p2) which Victor fixed late Thursday evening.

perfSONAR v3.4 Deployment

The default image for perfSONAR v3.4 from Internet2 (http://www.perfsonar.net/ download from http://software.internet2.edu/pS-Performance_Toolkit/ )  was used to rebuild tel-perfsonar-01.netcom.duke.edu.

This version of perfSONAR (released 10/7/14) supports using multiple NICs on the server and allows you to control which port is used for a given test.  Bandwidth testing can use NIC1 and latency testing can use NIC2 which allows the use of a single server for both tests.  This change will allow us to run perfSONAR in more locations on campus as we will not need to deploy perfSONAR nodes in pairs (one for latency and one for bandwidth).  We have not found that doing latency tests between nodes on campus is helpful, but latency measurement from off-campus hosts has proven to be useful.

The installation was done from CD and the netinstall method was used.  The “full install” did not work.  Installation was completed on Tuesday 10/14/14 around 1:30

perfSONAR Configuration

As noted above, the interface used for a test can be selected when a test is created:

Name the test:

perfSONAR configuration - 10-20-14 #1

Then you can choose the interface to use for the test from the drop-down menu:

perfSONAR configuration - 10-20-14 #2

In this case, the interface list on tel-perfsonar-01 shows all of the  interfaces on the box – the two built in 1G interfaces (em1 and em2) along with the the 10G interfaces (p2p1 and p2p2).  Note that the p2p1 interface also include the VLAN 1000 tagged interface that Victor defined for testing with UChicago and AL2S.  But that’s another post (Updated 10/21/14)

The interface for results display has also changed with version 3.4 – the old system provided a number of different screens to look at the various test results –

perfSONAR results - tel-perfsonar-01 to 192-168-10-4 (Chicago) - 2014-10-20 - Final

Note above the consolidation into a single graph of the bandwidth (axis on left) and the ping response times (axis on right) along with the line below which indicates when a test was run.

The graph above is for ping and bandwidth between tel-perfsonar-01 and a perfSONAR node mapped into the AL2S network by UChicago.  The ping times are very consistent but there is a lot of variation in the bandwidth.

The graph below is for bandwidth between tel-perfsonar-01 and tel-perfsonar-02.

perfSONAR results - tel-perfsonar-01 to tel-perfsonar-02 - 2014-10-20 - Final

Note the general consistency of the runs for bandwidth between those hosts.  THis test was configured to use the interface (p2p2) which is mapped to the production network connection:

perfSONAR configuration - 10-20-14 #3


Planned Updates to perfSONAR Topology

The perfSONAR nodes deployed across campus provide two primary sets of measurements – Latency and Bandwidth.  In our testing since the beginning of the year, we have gotten greater insights into the campus network from the bandwidth measurements than the latency measurements.  The latency measurements for wide area connections to Singapore (both the I2 and Duke services) and along the path to Singapore have been useful.  The latency measurements on campus often show “negative latency” due to the precision of the clock synchronization between the two servers.

Originally we had deployed pairs of perfSONAR nodes inside of departmental networks. We plan to re-deploy the boxes that are solely used for latency measurements to other places on the Duke network.  We also will reserve one of the Dell servers for ad hoc deployments to campus locations to help debug performance issues.

As noted earlier, we have seen value for latency measurements done outside of the Duke campus and will be keeping servers for latency measurements in Telcom and Fitz East.  We are also looking to confirm that we can use both NICs in the Dell servers to be able to simultaneously measure bandwidth and latency on the same box.  Note that this does require two 10G network connections in target data centers/buildings closets which should not be connected to over subscribed 10G network ports.

Ultimately we will end up with:

  1. Loaner/Test Server
  2. Bandwidth and Latency Measurement – Outside of all networks (edge/perimeter)
  3. Bandwidth and Latency Measurement – Campus Data Center
  4. Bandwidth and Latency Measurement – Inside network, outside of MPLS core
  5. Bandwidth and Latency Measurement – AL2S Network
  6. Bandwidth in Physics DC on Physics VRF
  7. Bandwidth in BioSci DC on Physics VRF
  8. Bandwidth in BioSci DC on Biology VRF
  9. Bandwidth in Library DC on Library VRF
  10. Bandwidth in DSCR on DSCR VRF


perfSONAR monitoring of campus network health

As noted in an earlier perfSONAR article we are using perfSONAR to monitor overall performance of connections to the campus core network and among nodes in different locations on the campus network.  In addition, we are using perfSONAR to identify problems with those connections.

For example, after enabling the 10Gbps connection of the BioSci building to the new core, we saw some strange behavior as shown in the graph below:

PS - fitz-perfsonar-03.oit to-from phy-pefsonar-02.phy - 2014-08-21

After the network upgrade was completed, one direction of traffic flow showed the expected improvements, but the reverse direction was poor.  The performance of the path from phy-perfsonar-02.phy.duke.edu -> fitz-perfsonar-03.oit.duke.edu did not improve as the Fitz East data center was migrated to the new core nor when the traffic was white listed at the IPS.  The problem was fixed in mid June when an interface on one of the core switches was found to have issues.  Traffic then greatly improved for the path from Physics to Fitz East and the traffic paths were symmetrical.  Traffic stayed consistent between the two paths until late July 2014 (7/23/14) when the traffic from Physics to Fitz East again showed a degradation when compared with the opposite direction.  On 8/12/14, updates to the connection of the core network to the Internet were made and performance again became consistent between inbound and outbound traffic between Fitz and Physics (detail shown below):

PS - fitz-perfsonar-03.oit to-from phy-pefsonar-02.phy - 2014-08-21 - DETAIL

We are instituting a regular review of a number of perfSONAR graphs by Duke’s Service Operations Center (SOC) in order to catch these issues early.  A simple ping of the path will work and so our normal monitoring services (link monitoring or ping monitoring) may not be sufficient to determine problems which only appear under load.  iPerf tests that are part of perfSONAR appear the best way to reliably monitor links for their usable and available bandwidth.

The perfSONAR monitoring of traffic between Fitz East and Physics seems to be a good barometer of the health of connections between the campus core and building networks.  A live view of this can be found at fitz-personar-03 (NetID login required).

perfSONAR Monitoring of OIT Network Upgrades

OIT has deployed a number of perfSONAR (PS) nodes around campus and have found that using PSfor bandwidth testing has identified a number of opportunities for bandwidth improvements as well as clearly showing the ongoing improvements to the Duke core network.

PS - fitz-perfsonar-03.oit to-from bio-pefsonar-02.biology - 2014-08-21

The initial data shows the performance of the network when connected via a 1 Gbps network connection to the original OIT core.  In mid-May, the network was migrated to the new core and connected at a speed of 10 Gbps.  However, at that time the Fitz East data center was not yet connected to the new core.  The reduction of network capacity from 1Gbps to 500 Mbps was tracked down and found to be related to the througput of a single stream through the Cisco Source Fire IPS devices used in the new core.   After whitelisting the traffic through the new IPS, the performance between the two servers was improved to about 1.5 Gbps although there was some asymmetry in the traffic rates between the two servers.  On June 9th, the Fitz East data center was moved to the new core network and bandwidth improved to a reliable 2.5 Gbps in each direction.  The only things in the path between the two servers were the SourceFire IPS (which was not inspecting the traffic) and a virtual firewall context.  It was surmised that the 2.5 Gbps limitation on bandwidth was due to the firewall.  The bio-perfsonar-02.biology.duke.edu server was taken off-line and migrated to a new IP address that was in the biology data center but not on the Biology VRF.  When the server was restored to service at the new IP address on July 9th, performance immediately improved to an expected 5-7 Gbps.

Similar data is shown below for the network connection between two servers on the same VRF but in different buildings.

Physics has servers in both the Physics Building as well as the BioSci building data center.  The graph below shows traffic flowing between phys-perfsonar-02.phy.duke.edu and bio-perfsonar-04.phys.duke.edu

PS - bio-perfsonar-04.phy to-from phy-pefsonar-02.phy - 2014-08-21

Both the Physics building and BioSci building were upgraded to 10Gbps and connected to the new core on May 15th (shown in more detail below).  The network between the two buildings immediately improved to delivery of 6-8 Gbps of bandwidth from the earlier limit of 1 Gbps.

PS - bio-perfsonar-04.phy to-from phy-pefsonar-02.phy - 2014-08-21 - DETAIL

It is important to remember that PS shows the available bandwidth, these graphs do not directly show how much is being used.

Arista testing notes

For various reasons, the Arista testing started with POX and ended with RYU controllers running the switches.

The server sdn-a4, which runs the controllers, had been left in an active state with the POX controllers running in a screen session for the duration of the testing.

The first set of tests was just load testing and ran without a problem.  I was unable to saturate the switches, even when sending as many as 6 files concurrently across one switch to various destinations.

Unfortunately the screen session running POX froze up and had to be killed out.  When it was revived, it refused to allow traffic across all of the ports.  It was speculated that this had something to do with the ARP tables filling up or being depopulated.

As a result of this traffic blockage, it was decided that we would repurpose the POX code for the RYU controllers and use RYU to load multiple rule sets onto the switches for the second stage of testing.

The raw data showed that sending 6 files across one switch with 700 rules per second came close to saturating the switches (with an average of 10G/second of traffic), but did not overload the CPUs of the switches, and they handled it with only a barely perceptible slowdown.

Arista switch preliminary testing

The Arista switches are racked, powered on, and plugged in.  After a very brief discovery process I got the SNMP MIBs for the ports and CPU load (imagine naming your MIBs after the actual port number printed on the outside of the case!!), I found that these switches don’t have the 64-bit packet load counters that the NECs had, so I get to do lots of math.  (Yes, I’m asking Arista, we’ll see.)

OpenDaylight is working quite well, but I do not offhand see how to add rules to it, whether it is running or not.

Protocol for testing network load, speed, and throughput from the point of view of the switches involved, using SNMP MIBs seen from a monitoring server.

The monitoring server watches the network loads and CPU loads during several different sets of conditions, ranging from no load to saturation of the network with both data packets and OpenFlow rules.

Hardware:

  • Dell chassis named A, B, and C, and blades named sdn-A1, A2, A3, B1, B3, C1, C2, and C3
  • 10G data ports from these blades to 10G Dell internal switches
  • Fibre from the 10G Dell switch to a GBIC connector
  • 10G OpenFlow NEC switches, connected in a variety of ways to one another and the 10G Dell internal switches via the 10G GBIC connector
  • Monitoring server in chassis C named sdn-C4 which can see all 3 NEC switches and do SNMP walks on them
  • 3650 Cisco switch connected to all of the NEC switches, as well as to sdn-C4

Software

  • GridFTP for transferring files
  • SNMPwalk for polling the hardware
  • Shell scripts (in bash) for controlling the GridFTP and SNMP processes over multiple servers
  • Tmux multi-session emulator which can be used to send the same command to multiple ssh sessions almost simultaneously
  • Screen (or tmux) to leave processes running and detach from them
  • Floodlight and POX to send OpenFlow rules to the NEC switches
  • Python to script OpenFlow rules
  • Excel for graphing data

Preliminary Discovery

  • A 1G file (1024*1024*1024= 1073741824) was sent from sdn-B1 to sdn-C1 forty times to confirm the SNMP counter increment.
  • The start time for the 40 pushes was 14:36:44

Method

  • On each of the data blades (sdn-A1 through sdn-C3) set up files 8Gb in size (1024*1024*1024*8 bits = ).  These are filled with the number 1, over and over.
  • Using GridFTP, set up a method for transferring the files over the 10G network easily without filling up the destination hard drive (gftp_send_files-var.sh).
  • Also set up a method for sending two or more instances of this file to and from the same machines simultaneously (for example, from sdn-A1 to sdn-B1 and sdn-A1 to sdn-B1) via GridFTP from different ssh sessions via tmux or cron jobs.
    • A sample tmux command-line instruction such as this would ensure that all monitoring in windows 5 and 7 began simultaneously, for example:  for line in 5 7 ;do tmux select-window -t $line;tmux send-keys “sh code/snmp_code/watch_port.sh 3 18$line”;done;tmux select-window -t 0
    • Capture the send data from the server’s point of view using the ‘time’ command. (also gftp_send_files-var.sh).
    • Write a script to use the SNMPwalk protocol to record the difference on the octet counters, called IfHCOctetIn and IfHCOctetOut, on the switch ports while the GridFTP sends are running, with timestamps and a 10-second sampling rate.  The SNMP MIBs are by port identifier, which is not the same as port number.  “In” refers to the data coming in to the switch through that port, whereas “Out” refers to the data leaving the switch by that port (watch_port.sh).
    • While the GridFTP sends are running, sets of OpenFlow rules are pushed to the server, starting at a 100 rules per second test and increasing in the next sets to 300 and then to 700 rules per second.  Mark the start and stop times of the tests (pox.py).
    • Use Excel formulae to calculate the difference in the SNMP counters, keeping in mind the idea that the counters “roll” (reset to zero) about once per day.
    • The counters are recording the number of bytes (8 bits) that have gone by since the last recorded counter instance, up to 2^64, such that a counter reading of 478041734 would mean a total of 3824333872 bits had gone through that port since the last roll-over of the counter (to 0).
    • Use another script to SNMPwalk the CPU load average while the send tests are running.

Controls

  • Source and destination nodes (sdn-A1 through sdn-C3) across one, two, or three switches – even within the same chassis packets are sent out to the external switch and back in again.  This means that packets sent from A1 to A2 are sent across one switch, from A1 to B1 across two, and A1 to C1 can be across two or three switches depending on the rules set in OpenFlow.
  • Size of file sent (8Gb)
  • Number of files sent from the same server at the same time (1-?)
  • Number of sends going through a given switch at a time (1-?)
  • Number of rules pushed to the switches (0-70­0)

Data Interpretation

  • In Excel, each network throughput counter reading is compared with the one previous to it, to calculate the difference between them.  Care must be taken to make sure that the “roll-over” is checked for, leading to an if-then formula in Excel:
=IF(port!B2<port!B1,((2^64)-(((2^64)-port!B1)+port!B2)),port!B2-port!B1)

meaning that if a number is smaller than the one before it, the difference between it and the end of the counter (2^64) is subtracted from the difference between the prior number and the beginning of the counter (0).  Otherwise, the prior number is simply subtracted from the current number.

Over time, this result can be plotted to show a distinct curve as data throughput is increased or decreased.

  • While these data are processed, it is crucial to note the start times for pushing the testing files (4G or 8G) and also the start times and end times for pushing OpenFlow rules.
  • The CPU load average numbers can be plotted in Excel.

Scripts

Watch_port.sh

#!/bin/bash
# Need switch (2,3, or 4) and port # - 145-195
switch=$1
port=$2 
if [ -z "$switch" ]
then
echo "Need switch by IP (2, 3, or 4)"
exit
fi
if [ -z "$port" ]
then
echo "Need port OID (145-195)"
exit
fi
echo "This loop will run until you ctrl-c it." 
while [ "$switch" > 1 ]
do
secs=`date | cut -d ' ' -f 5`
walkout=`snmpwalk -c openflow -v1 -On 10.138.97.$switch ifHCOutOctets.$port | cut -d. -f 13 | cut -d ' ' -f 4`
compositeout="$secs,$walkout"
#       echo $compositeout
echo $compositeout >> /home/bryn/data/R$switch-P$port.switch.ifHCOutOctets.nec.csv
walkin=`snmpwalk -c openflow -v1 -On 10.138.97.$switch ifHCInOctets.$port | cut -d. -f 13 | cut -d ' ' -f 4`
compositein="$secs,$walkin"
#       echo $compositein
echo $compositein  >> /home/bryn/data/R$switch-P$port.switch.ifHCInOctets.nec.csv
secs=''
walkout=''
compositeout=''
compositein=''
sleep 10
done

gftp_send_files-var.sh

#!/bin/bash
# Puts the given file on each of the 9 machines via the SDN network, and writes the output to /home/bryn/log/$hostname-gridftp-$size-$today.out.
# It sits in crontab and will run every hour on the hour or whatever test timing seems appropriate.
hostname=`hostname -s`
size=$1;
line=$2;
instance=$3;
if [ -z "$size" ]
then
echo "Need size (4G or 8G) "
exit
fi
if [ -z "$line" ]
then
echo "Need target (A1, A2, A3, B1, B2, B3, C1, C2, C3) "
exit
fi
if [ -z "$instance" ]
then
echo "instance ? of ? (i.e. 2 of 3)?"
exit
fi
start=''
stop=''
filename="/home/bryn/log/$hostname-gridftp-$size-$instance.out"
echo >> $filename
echo $filename
echo $line-10g
echo
echo >> $filename
echo To: sdn-$line-10g >> $filename
start=`date +%T`
echo Start: $start >> $filename
/usr/bin/time -v -ao$filename /usr/bin/globus-url-copy -v file:///home/bryn/data/$hostname-$size.txt sshftp://sdn-$line-10g/ramdisk/$hostname-$size-$instance-received.txt
echo /usr/bin/time -v -ao$filename /usr/bin/globus-url-copy -v file:///home/bryn/data/$hostname-$size.txt sshftp://sdn-$line-10g/ramdisk/$hostname-$size-$instance-received.txt
stop=`date +%T`
echo Stop: $stop >> $filename
echo >> $filename
####  WARNING - this will fill up / very quickly, do something!
ssh sdn-$line-10g rm /ramdisk/$hostname-$size-$instance-received.txt

pox.py

#!/bin/sh -
# Copyright 2011-2012 James McCauley
#
# Licensed under the Apache License, Version 2.0 (the "License");
# you may not use this file except in compliance with the License.
# You may obtain a copy of the License at:
#
#     http://www.apache.org/licenses/LICENSE-2.0
#
# Unless required by applicable law or agreed to in writing, software
# distributed under the License is distributed on an "AS IS" BASIS,
# WITHOUT WARRANTIES OR CONDITIONS OF ANY KIND, either express or implied.
# See the License for the specific language governing permissions and
# limitations under the License.
# If you have PyPy 1.6+ in a directory called pypy alongside pox.py, we
# use it.
# Otherwise, we try to use a Python interpreter called python2.7, which
# is a good idea if you're using Python from MacPorts, for example.
# We fall back to just "python" and hope that works.
''''true
#export OPT="-u -O"
export OPT="-u"
export FLG=""
if [ "$(basename $0)" = "debug-pox.py" ]; then
export OPT=""
export FLG="--debug"
fi
if [ -x pypy/bin/pypy ]; then
exec pypy/bin/pypy $OPT "$0" $FLG "$@"
fi
if type python2.7 > /dev/null 2> /dev/null; then
exec python2.7 $OPT "$0" $FLG "$@"
fi
exec python $OPT "$0" $FLG "$@"
'''
from pox.boot import boot
if __name__ == '__main__':
boot()

Test 1 700 rules

Send 8G files from sdn-a1 to sdn-b1 and sdn-a2 to sdn-b3 (b2 is still AWOL) while monitoring the rate of change of the SNMP counters for ports in switches OF-1 and OF-2 in from sdn-a1, between the switches, and out to sdn-b1 and the same for sdn-a2 -> b3.  The SNMP sampling rate is once/10 seconds, and the difference to the counters is calculated in the spreadsheet.
The files were sent starting at 11:25:48.

During that test, 700 OpenFlow rules per second were pushed, starting at 11:30:27.
These graphs are in order, from sdn-a1 and a2 to switch of-1 to switch of-2 to sdn-b1 and b3.

Test 1 300 Rules

Send 8G files from sdn-a1 to sdn-b1 and sdn-a2 to sdn-b3 (b2 is still AWOL) while monitoring the rate of change of the SNMP counters for ports in switches OF-1 and OF-2 in from sdn-a1, between the switches, and out to sdn-b1 and the same for sdn-a2 -> b3.  The SNMP sampling rate is once/10 seconds, and the difference to the counters is calculated in the spreadsheet.
The files were sent starting at 15:49:29.

During that test, 300 OpenFlow rules per second were pushed, starting at 16:02:54 .
These graphs are in order, from sdn-a1 and a2 to switch of-1 to switch of-2 to sdn-b1 and b3.