Category Archives: perfSONAR

AL2S Network Setup and Testing Summary

In an earlier post I described the setup of the new v3.4 perfSONAR node used to test the AL2S network.  In this post I will summarize the results of the 1 week test done on the AL2S link to UChicago along with a description of the work that Victor did to setup the link.

Setup

The TelCom Arista has a PerfSonar box connected to it, on port 17.
The TelCom Arista *also* has a connection to AL2S, via MCNC, that arrives via port 1.
We share the connection through AL2S with RENCI, and RENCI has allocated us 100 VLAN tags to use (1000-1099, inclusive).

Last week, Victor allocated a 5 Gbps circuit for testing between Duke and Chicago.
It is using VLAN tag 1000 (on our end), and expired at 4 PM on Monday (10/20/14).
AL2S performs a tag flip somewhere in the link, so that our VLAN tag 1000 becomes VLAN tag 3000 at Chicago’s end.

The first thing we did was to test in traditional switch mode.
This meant:
1) Allocating VLAN 1000 on the TelCom Arista
2) Ensuring that port 1 was in trunk mode, and that tags 1000-1099 were allowed
3) Ensuring that port 17 was in access mode for tag 1000
4) Setting up a VLAN interface for tag 1000

We agreed with Chicago to use the private subnet 192.168.10.0/24 for testing.
The VLAN interface on the TelCom Arista was configured to use address 192.168.10.2; the Chicago switch was configured to use 192.168.10.1.
After confirming connectivity between the switches, the PerfSonar boxes at each end were configured with addresses 192.168.10.3 (Duke) and 192.168.10.4 (Chicago).

Once we had done a bit of testing in traditional switch mode, we chose to test the OpenFlow capability, using rest_router.
To set this up, Victor did the following:
1) Add port 1 to the OpenFlow instance on the TelCom Arista
2) Add port 17 to the OpenFlow instance on the TelCom Arista
3) Configure port 17 into trunk mode on the TelCom Arista; ports in access mode do not function in OpenFlow mode
4) Add a vlan tagged interface to the PerfSonar box hanging off port 17; this was accomplished thus:
a) ifconfig p2p1 0.0.0.0
b) modprobe 8021q
c) vconfig add p2p1 1000
d) ifconfig p2p1.1000 192.168.10.3 netmask 255.255.255.0 up mtu 9000
5) Add the private address range to rest_router’s management using curl, thus:
curl -X POST -d ‘{“address”:”192.168.10.254/24″}’ http://sdn-prod-01.oit.duke.edu:8080/router/0000001c7365b107/1000

At this point, packets were being switched onto the AL2S link, within the TelCom Arista, using OpenFlow rules.

Since roughly Tuesday afternoon, perfSonar running measurements against the peer perfSonar box at Chicago.
The bandwidth data has been pretty noisy, both with traditional switching and with OpenFlow.
We expect that there’s some bandwidth contention; and would be curious to see how the results look with bwctl being run in parallel mode within the web interface.
When bwctl is run manually (and explicitly specify the degree of parallelism), we get fairly consistent (and high) results that exceed the requested bandwidth of the link (typically very close to 10 Gbps –

Command Line BWCTL Results:

[root@tel-perfsonar-01 ~]# bwctl -c 192.168.10.4 -P8
bwctl: Using tool: iperf
bwctl: 36 seconds until test results available
RECEIVER START
------------------------------------------------------------
Server listening on TCP port 5239
Binding to local address 192.168.10.4
TCP window size: 87380 Byte (default)
------------------------------------------------------------
[ 15] local 192.168.10.4 port 5239 connected with 192.168.10.3 port 57265
[ 17] local 192.168.10.4 port 5239 connected with 192.168.10.3 port 49730
[ 16] local 192.168.10.4 port 5239 connected with 192.168.10.3 port 58667
[ 18] local 192.168.10.4 port 5239 connected with 192.168.10.3 port 53343
[ 19] local 192.168.10.4 port 5239 connected with 192.168.10.3 port 41485
[ 20] local 192.168.10.4 port 5239 connected with 192.168.10.3 port 55678
[ 21] local 192.168.10.4 port 5239 connected with 192.168.10.3 port 39032
[ 22] local 192.168.10.4 port 5239 connected with 192.168.10.3 port 39575

[ ID] Interval       Transfer     Bandwidth

[ 22]  0.0-10.0 sec  3123445760 Bytes  2488803881 bits/sec
[ 22] MSS size 8948 bytes (MTU 8988 bytes, unknown interface)
[ 17]  0.0-10.1 sec  1780350976 Bytes  1413963232 bits/sec
[ 17] MSS size 8948 bytes (MTU 8988 bytes, unknown interface)
[ 15]  0.0-10.1 sec  1054474240 Bytes  832376766 bits/sec
[ 15] MSS size 8948 bytes (MTU 8988 bytes, unknown interface)
[ 21]  0.0-10.1 sec  1462370304 Bytes  1154438086 bits/sec
[ 21] MSS size 8948 bytes (MTU 8988 bytes, unknown interface)
[ 18]  0.0-10.2 sec  1421213696 Bytes  1117543689 bits/sec
[ 18] MSS size 8948 bytes (MTU 8988 bytes, unknown interface)
[ 20]  0.0-10.2 sec  1135476736 Bytes  890163568 bits/sec
[ 20] MSS size 8948 bytes (MTU 8988 bytes, unknown interface)
[ 16]  0.0-10.2 sec  858259456 Bytes  672128900 bits/sec
[ 16] MSS size 8948 bytes (MTU 8988 bytes, unknown interface)
[ 19]  0.0-10.2 sec  930742272 Bytes  727474666 bits/sec
[ 19] MSS size 8948 bytes (MTU 8988 bytes, unknown interface)
[SUM]  0.0-10.2 sec  11766333440 Bytes  9196648461 bits/sec

Wed Oct 15 14:06:26 EDT 2014

Which shows about 9.2 Gbps which is great.

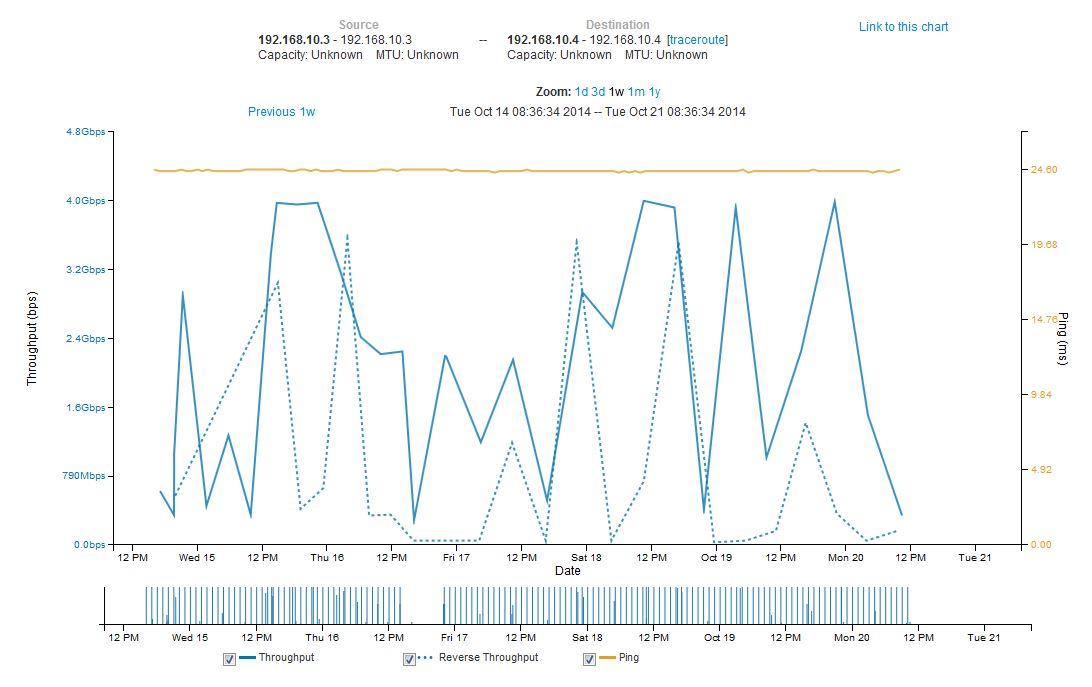
The full results for the bandwidth testing using the perfSONAR GUI is shown below:

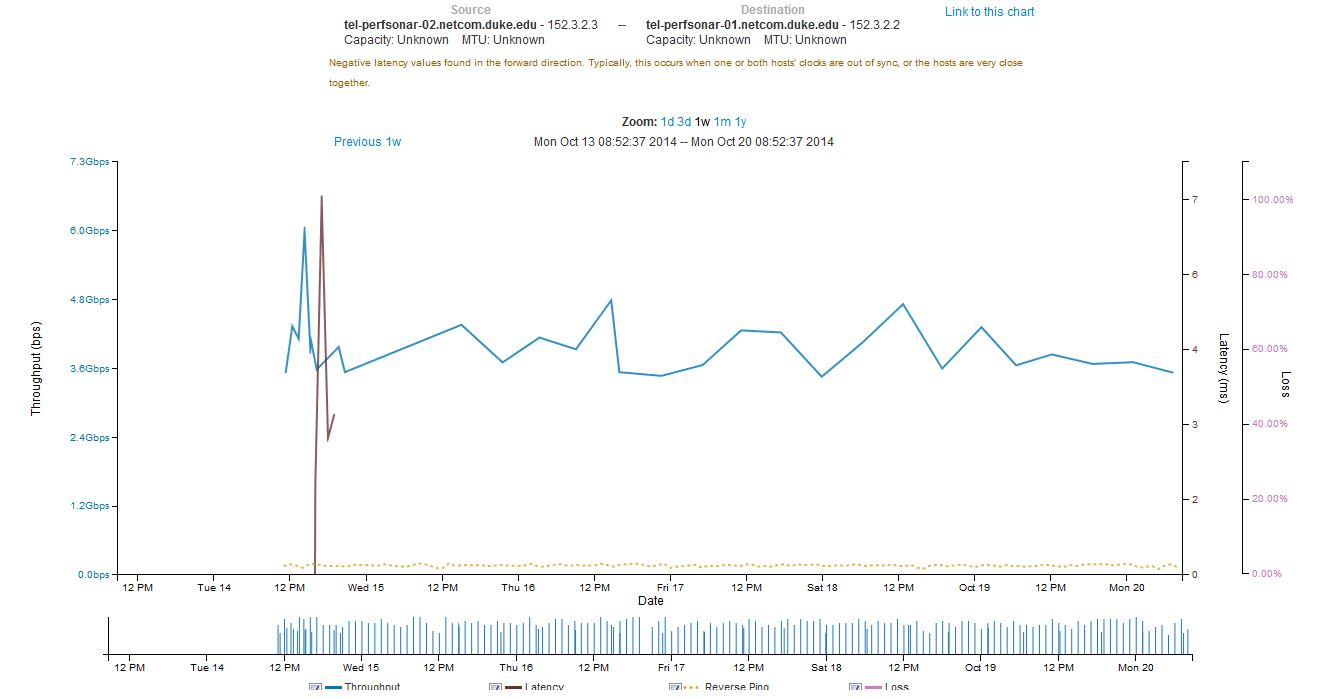
perfSONAR results - tel-perfsonar-01 to 192-168-10-4 (Chicago) - 2014-10-21 - Final - Full Week

A couple of items to note –

  1. General variation of the bandwidth – inbound and outbound bandwidth over the link to the UChicago perfSONAR node varied broadly.
  2. Consistency of ping times – the ping times from tel-perfsonar-01 (192.168.10.3) to the UChicago node (192.168.10.4) where rock solid at 24.6 msec and did not vary when the Arista switch was in normal mode vs. OpenFlow mode.
  3. The lack of data between 4PM and 10 PM on Thursday 10/16/14 was due to Charley incorrectly setting the IP address on the primary network interface (p2p2) which Victor fixed late Thursday evening.
perfSONAR v3.4 Deployment

The default image for perfSONAR v3.4 from Internet2 (http://www.perfsonar.net/ download from http://software.internet2.edu/pS-Performance_Toolkit/ )  was used to rebuild tel-perfsonar-01.netcom.duke.edu.

This version of perfSONAR (released 10/7/14) supports using multiple NICs on the server and allows you to control which port is used for a given test.  Bandwidth testing can use NIC1 and latency testing can use NIC2 which allows the use of a single server for both tests.  This change will allow us to run perfSONAR in more locations on campus as we will not need to deploy perfSONAR nodes in pairs (one for latency and one for bandwidth).  We have not found that doing latency tests between nodes on campus is helpful, but latency measurement from off-campus hosts has proven to be useful.

The installation was done from CD and the netinstall method was used.  The “full install” did not work.  Installation was completed on Tuesday 10/14/14 around 1:30

perfSONAR Configuration

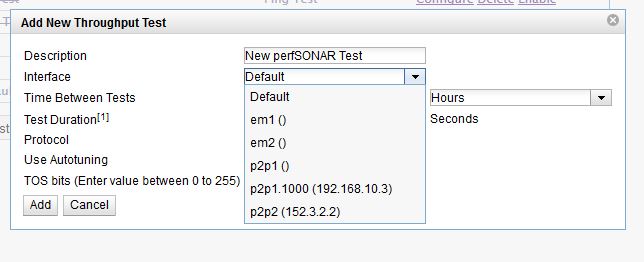
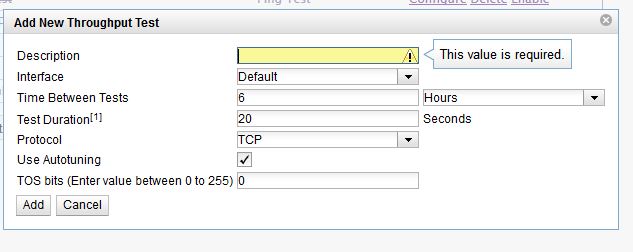
As noted above, the interface used for a test can be selected when a test is created:

Name the test:

perfSONAR configuration - 10-20-14 #1

Then you can choose the interface to use for the test from the drop-down menu:

perfSONAR configuration - 10-20-14 #2

In this case, the interface list on tel-perfsonar-01 shows all of the  interfaces on the box – the two built in 1G interfaces (em1 and em2) along with the the 10G interfaces (p2p1 and p2p2).  Note that the p2p1 interface also include the VLAN 1000 tagged interface that Victor defined for testing with UChicago and AL2S.  But that’s another post (Updated 10/21/14)

The interface for results display has also changed with version 3.4 – the old system provided a number of different screens to look at the various test results –

perfSONAR results - tel-perfsonar-01 to 192-168-10-4 (Chicago) - 2014-10-20 - Final

Note above the consolidation into a single graph of the bandwidth (axis on left) and the ping response times (axis on right) along with the line below which indicates when a test was run.

The graph above is for ping and bandwidth between tel-perfsonar-01 and a perfSONAR node mapped into the AL2S network by UChicago.  The ping times are very consistent but there is a lot of variation in the bandwidth.

The graph below is for bandwidth between tel-perfsonar-01 and tel-perfsonar-02.

perfSONAR results - tel-perfsonar-01 to tel-perfsonar-02 - 2014-10-20 - Final

Note the general consistency of the runs for bandwidth between those hosts.  THis test was configured to use the interface (p2p2) which is mapped to the production network connection:

perfSONAR configuration - 10-20-14 #3


Planned Updates to perfSONAR Topology

The perfSONAR nodes deployed across campus provide two primary sets of measurements – Latency and Bandwidth.  In our testing since the beginning of the year, we have gotten greater insights into the campus network from the bandwidth measurements than the latency measurements.  The latency measurements for wide area connections to Singapore (both the I2 and Duke services) and along the path to Singapore have been useful.  The latency measurements on campus often show “negative latency” due to the precision of the clock synchronization between the two servers.

Originally we had deployed pairs of perfSONAR nodes inside of departmental networks. We plan to re-deploy the boxes that are solely used for latency measurements to other places on the Duke network.  We also will reserve one of the Dell servers for ad hoc deployments to campus locations to help debug performance issues.

As noted earlier, we have seen value for latency measurements done outside of the Duke campus and will be keeping servers for latency measurements in Telcom and Fitz East.  We are also looking to confirm that we can use both NICs in the Dell servers to be able to simultaneously measure bandwidth and latency on the same box.  Note that this does require two 10G network connections in target data centers/buildings closets which should not be connected to over subscribed 10G network ports.

Ultimately we will end up with:

  1. Loaner/Test Server
  2. Bandwidth and Latency Measurement – Outside of all networks (edge/perimeter)
  3. Bandwidth and Latency Measurement – Campus Data Center
  4. Bandwidth and Latency Measurement – Inside network, outside of MPLS core
  5. Bandwidth and Latency Measurement – AL2S Network
  6. Bandwidth in Physics DC on Physics VRF
  7. Bandwidth in BioSci DC on Physics VRF
  8. Bandwidth in BioSci DC on Biology VRF
  9. Bandwidth in Library DC on Library VRF
  10. Bandwidth in DSCR on DSCR VRF


perfSONAR monitoring of campus network health

As noted in an earlier perfSONAR article we are using perfSONAR to monitor overall performance of connections to the campus core network and among nodes in different locations on the campus network.  In addition, we are using perfSONAR to identify problems with those connections.

For example, after enabling the 10Gbps connection of the BioSci building to the new core, we saw some strange behavior as shown in the graph below:

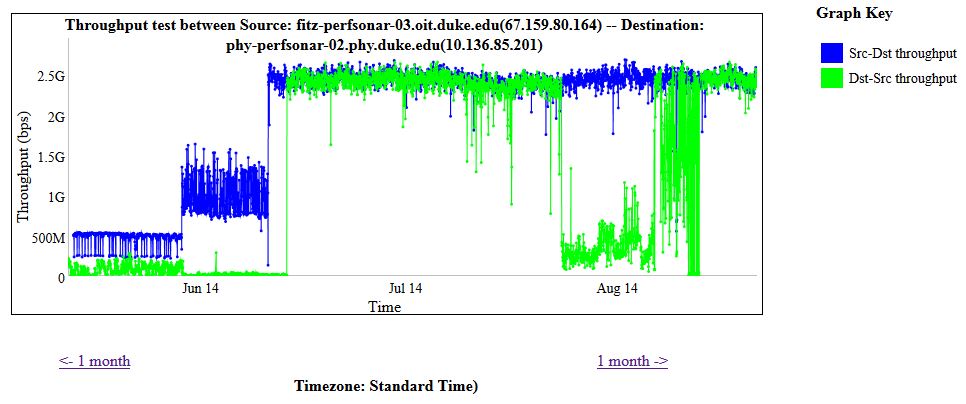
PS - fitz-perfsonar-03.oit to-from phy-pefsonar-02.phy - 2014-08-21

After the network upgrade was completed, one direction of traffic flow showed the expected improvements, but the reverse direction was poor.  The performance of the path from phy-perfsonar-02.phy.duke.edu -> fitz-perfsonar-03.oit.duke.edu did not improve as the Fitz East data center was migrated to the new core nor when the traffic was white listed at the IPS.  The problem was fixed in mid June when an interface on one of the core switches was found to have issues.  Traffic then greatly improved for the path from Physics to Fitz East and the traffic paths were symmetrical.  Traffic stayed consistent between the two paths until late July 2014 (7/23/14) when the traffic from Physics to Fitz East again showed a degradation when compared with the opposite direction.  On 8/12/14, updates to the connection of the core network to the Internet were made and performance again became consistent between inbound and outbound traffic between Fitz and Physics (detail shown below):

PS - fitz-perfsonar-03.oit to-from phy-pefsonar-02.phy - 2014-08-21 - DETAIL

We are instituting a regular review of a number of perfSONAR graphs by Duke’s Service Operations Center (SOC) in order to catch these issues early.  A simple ping of the path will work and so our normal monitoring services (link monitoring or ping monitoring) may not be sufficient to determine problems which only appear under load.  iPerf tests that are part of perfSONAR appear the best way to reliably monitor links for their usable and available bandwidth.

The perfSONAR monitoring of traffic between Fitz East and Physics seems to be a good barometer of the health of connections between the campus core and building networks.  A live view of this can be found at fitz-personar-03 (NetID login required).

perfSONAR Monitoring of OIT Network Upgrades

OIT has deployed a number of perfSONAR (PS) nodes around campus and have found that using PSfor bandwidth testing has identified a number of opportunities for bandwidth improvements as well as clearly showing the ongoing improvements to the Duke core network.

PS - fitz-perfsonar-03.oit to-from bio-pefsonar-02.biology - 2014-08-21

The initial data shows the performance of the network when connected via a 1 Gbps network connection to the original OIT core.  In mid-May, the network was migrated to the new core and connected at a speed of 10 Gbps.  However, at that time the Fitz East data center was not yet connected to the new core.  The reduction of network capacity from 1Gbps to 500 Mbps was tracked down and found to be related to the througput of a single stream through the Cisco Source Fire IPS devices used in the new core.   After whitelisting the traffic through the new IPS, the performance between the two servers was improved to about 1.5 Gbps although there was some asymmetry in the traffic rates between the two servers.  On June 9th, the Fitz East data center was moved to the new core network and bandwidth improved to a reliable 2.5 Gbps in each direction.  The only things in the path between the two servers were the SourceFire IPS (which was not inspecting the traffic) and a virtual firewall context.  It was surmised that the 2.5 Gbps limitation on bandwidth was due to the firewall.  The bio-perfsonar-02.biology.duke.edu server was taken off-line and migrated to a new IP address that was in the biology data center but not on the Biology VRF.  When the server was restored to service at the new IP address on July 9th, performance immediately improved to an expected 5-7 Gbps.

Similar data is shown below for the network connection between two servers on the same VRF but in different buildings.

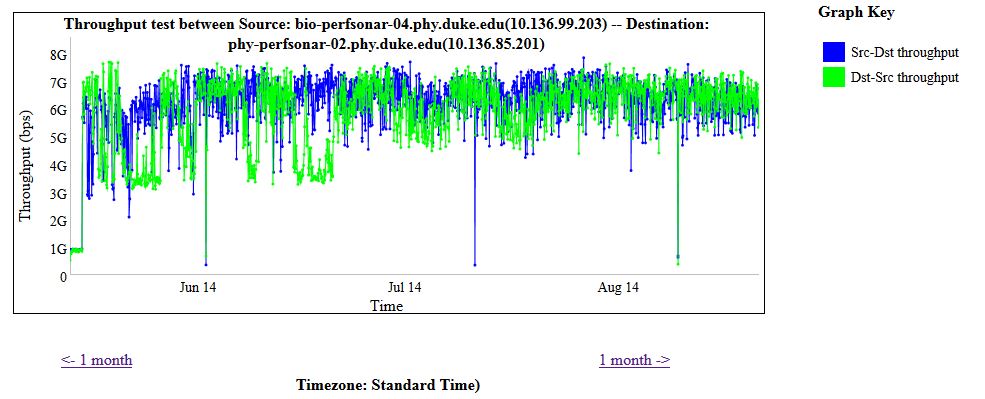
Physics has servers in both the Physics Building as well as the BioSci building data center.  The graph below shows traffic flowing between phys-perfsonar-02.phy.duke.edu and bio-perfsonar-04.phys.duke.edu

PS - bio-perfsonar-04.phy to-from phy-pefsonar-02.phy - 2014-08-21

Both the Physics building and BioSci building were upgraded to 10Gbps and connected to the new core on May 15th (shown in more detail below).  The network between the two buildings immediately improved to delivery of 6-8 Gbps of bandwidth from the earlier limit of 1 Gbps.

PS - bio-perfsonar-04.phy to-from phy-pefsonar-02.phy - 2014-08-21 - DETAIL

It is important to remember that PS shows the available bandwidth, these graphs do not directly show how much is being used.

Perfsonar configuration

This post is mainly a place to stash information about the perfsonar configuration.  The perfsonar image isn’t great at keeping prior configs, so we’ll probably need this again the next time it updates.

This last update turned off sdn, turned off bwctl, and made owamp be the only test allowed.  I had to go to https://fitz-perfsonar-02.oit.duke.edu/toolkit/admin/enabled_services/ and turn on the checkboxes for PingER, perfSONAR-BUOY Throughput and Latency Testing and Measurement Archive, BWCTL, OWAMP, SSH, and Traceroute MA and Scheduler.

perfSONAR Test Results – 10/28/13 to 10/31/13

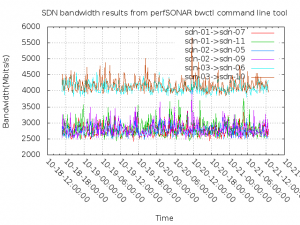
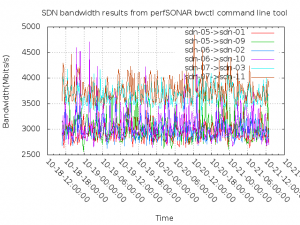
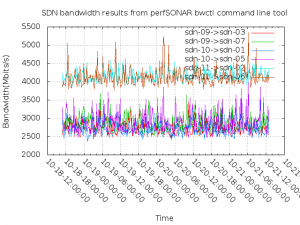
Jianan Wang ran a series of perfSONAR runs that included runs that overlapped their timing and runs that were done with no overlap.

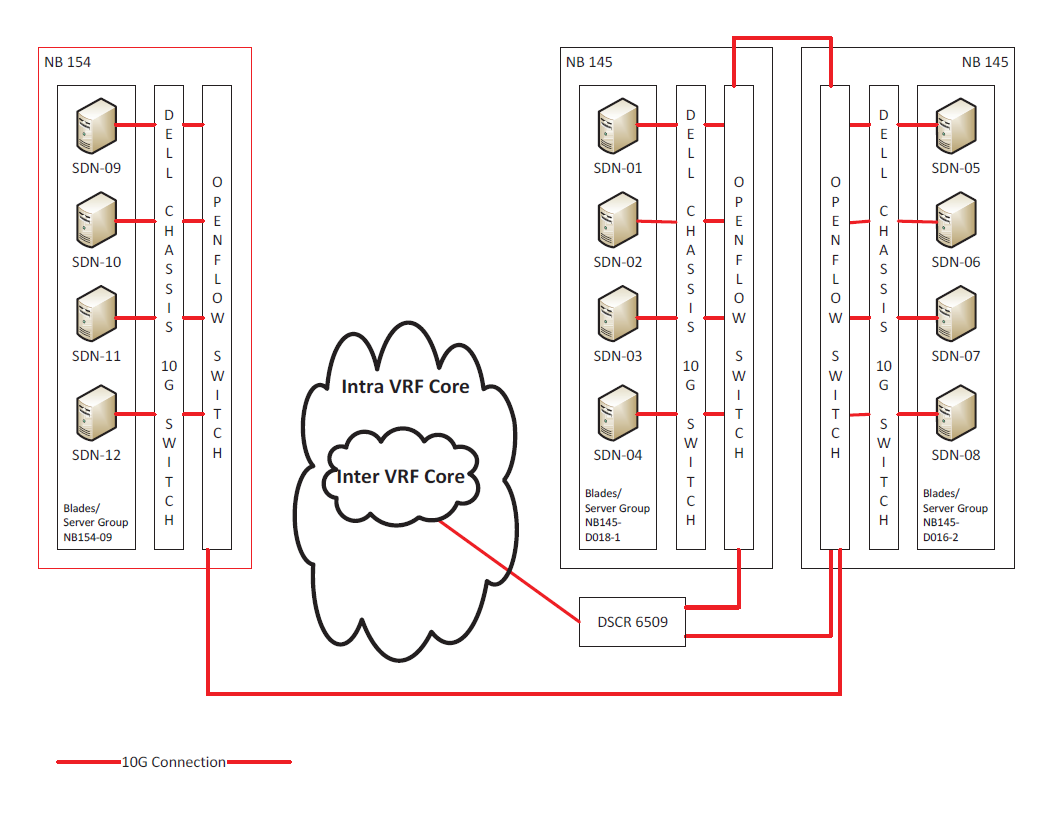
The three blade chassis, each containing four blade servers, are connected to three independent OpenFlow switches.

Connections between blades SDN09/SDN10/SDN11/SDN12 to SDN05/SDN06/SDN07/SDN08 traverse two OpenFlow switches

Connections between blades SDN09/SDN10/SDN11/SDN12 to SDN01/SDN02/SDN03/SDN04 traverse three OpenFlow switches

As expected, the runs with no overlap showed approximately 9 Gbps of available bandwidth for traffic that ran through two switches, while the runs that overlapped (across three servers) showed approximately 3 Gbps of available bandwidth

A reduction of 1 Gbps was seen in traffic that flowed across the additional switch for the unblocked test.

SDN09 Rates

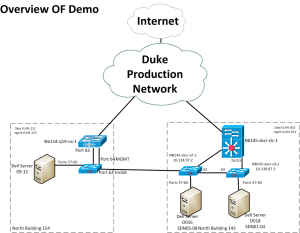
As a reminder, here is an overview of the server topology

SDN Topology Image

Here is a shorter time window that shows the variation between blocking and non-blocking perfSONAR tests (note that this is for SDN10 connections to SDN01 and SDN05).

SDN10 Rates

perfSONAR Tests – 9/03/13 – Bandwidth Testing Between Blade Chassis

 
perfSONAR test from SDN-09 to SDN-01, SDN-02, and SDN-12

Jianan Wang ran a series of pefSONAR tests from approximately 12:00 AM on 9/3/13 to 4:00 AM on 9/4/13.

These test were run from SDN-09 (in NB154) to SDN-01 and SDN-02 in NB-145 (DSCR).

The results are shown below:

perfSONAR test from SDN-09 to SDN-01, SDN-02, and SDN-12

As expected, the performance that stayed ‘in chassis’ from SDN-09 to SDN-12 was constant at about 9 GBPS.  The performance achieved for inter chassis communication that is required to go through the core network on the openflow VRF showed significant variability.  Post testing it was determined that testing from machines in the DSCR to the OIT NAS heads in NB154 was responsible for the performance degradation during the day.  Given that SDN-01 and SDN-02 are in the same chassis we are not certain of the cause of the difference in performance between them during the period of midnight to 10 AM, but they appeared to converge to between 8 and 8.5 Gbps after midnight on the 3rd.

Testing Processes

A series of bandwidth tests have been performed using the existing production network in order to understand baseline performance capabilities as well as confirming the impact that large file transfers have on the network.

It was assumed that a 10G connected server would not be able to impact the core 20G Duke network.  However, we have seen multiple impacts on the Duke network due to baseline testing for this project.

perfSONAR tests have been shown to be NON intrusive, but large, dedicated load cannons that do sustained file transfers have highlighted capacity issues in the core Duke academic campus network.