Category Archives: Network Performance

Planned Updates to perfSONAR Topology

The perfSONAR nodes deployed across campus provide two primary sets of measurements – Latency and Bandwidth.  In our testing since the beginning of the year, we have gotten greater insights into the campus network from the bandwidth measurements than the latency measurements.  The latency measurements for wide area connections to Singapore (both the I2 and Duke services) and along the path to Singapore have been useful.  The latency measurements on campus often show “negative latency” due to the precision of the clock synchronization between the two servers.

Originally we had deployed pairs of perfSONAR nodes inside of departmental networks. We plan to re-deploy the boxes that are solely used for latency measurements to other places on the Duke network.  We also will reserve one of the Dell servers for ad hoc deployments to campus locations to help debug performance issues.

As noted earlier, we have seen value for latency measurements done outside of the Duke campus and will be keeping servers for latency measurements in Telcom and Fitz East.  We are also looking to confirm that we can use both NICs in the Dell servers to be able to simultaneously measure bandwidth and latency on the same box.  Note that this does require two 10G network connections in target data centers/buildings closets which should not be connected to over subscribed 10G network ports.

Ultimately we will end up with:

  1. Loaner/Test Server
  2. Bandwidth and Latency Measurement – Outside of all networks (edge/perimeter)
  3. Bandwidth and Latency Measurement – Campus Data Center
  4. Bandwidth and Latency Measurement – Inside network, outside of MPLS core
  5. Bandwidth and Latency Measurement – AL2S Network
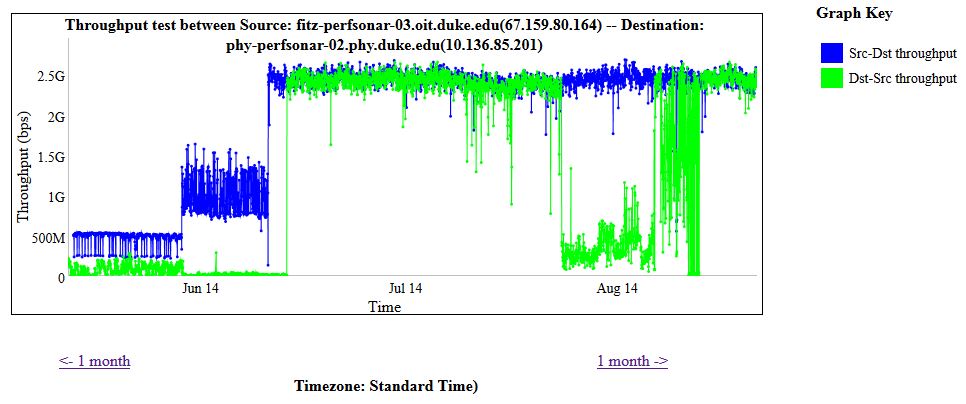
  6. Bandwidth in Physics DC on Physics VRF
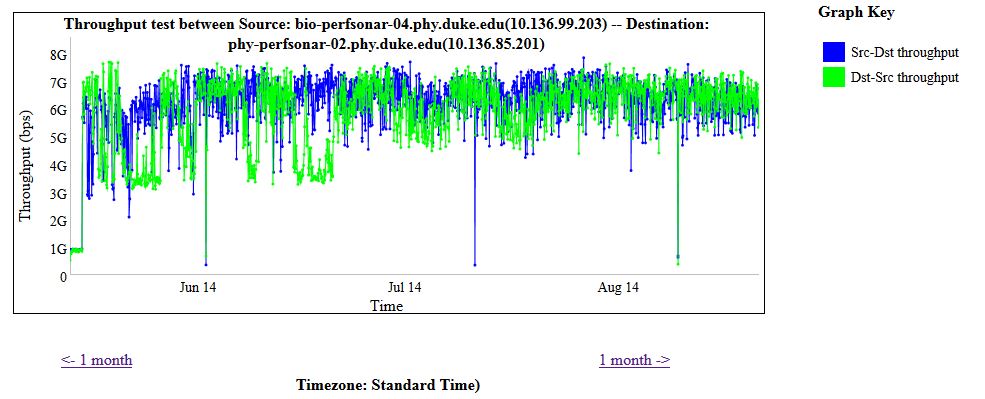
  7. Bandwidth in BioSci DC on Physics VRF
  8. Bandwidth in BioSci DC on Biology VRF
  9. Bandwidth in Library DC on Library VRF
  10. Bandwidth in DSCR on DSCR VRF


perfSONAR monitoring of campus network health

As noted in an earlier perfSONAR article we are using perfSONAR to monitor overall performance of connections to the campus core network and among nodes in different locations on the campus network.  In addition, we are using perfSONAR to identify problems with those connections.

For example, after enabling the 10Gbps connection of the BioSci building to the new core, we saw some strange behavior as shown in the graph below:

PS - fitz-perfsonar-03.oit to-from phy-pefsonar-02.phy - 2014-08-21

After the network upgrade was completed, one direction of traffic flow showed the expected improvements, but the reverse direction was poor.  The performance of the path from phy-perfsonar-02.phy.duke.edu -> fitz-perfsonar-03.oit.duke.edu did not improve as the Fitz East data center was migrated to the new core nor when the traffic was white listed at the IPS.  The problem was fixed in mid June when an interface on one of the core switches was found to have issues.  Traffic then greatly improved for the path from Physics to Fitz East and the traffic paths were symmetrical.  Traffic stayed consistent between the two paths until late July 2014 (7/23/14) when the traffic from Physics to Fitz East again showed a degradation when compared with the opposite direction.  On 8/12/14, updates to the connection of the core network to the Internet were made and performance again became consistent between inbound and outbound traffic between Fitz and Physics (detail shown below):

PS - fitz-perfsonar-03.oit to-from phy-pefsonar-02.phy - 2014-08-21 - DETAIL

We are instituting a regular review of a number of perfSONAR graphs by Duke’s Service Operations Center (SOC) in order to catch these issues early.  A simple ping of the path will work and so our normal monitoring services (link monitoring or ping monitoring) may not be sufficient to determine problems which only appear under load.  iPerf tests that are part of perfSONAR appear the best way to reliably monitor links for their usable and available bandwidth.

The perfSONAR monitoring of traffic between Fitz East and Physics seems to be a good barometer of the health of connections between the campus core and building networks.  A live view of this can be found at fitz-personar-03 (NetID login required).

perfSONAR Monitoring of OIT Network Upgrades

OIT has deployed a number of perfSONAR (PS) nodes around campus and have found that using PSfor bandwidth testing has identified a number of opportunities for bandwidth improvements as well as clearly showing the ongoing improvements to the Duke core network.

PS - fitz-perfsonar-03.oit to-from bio-pefsonar-02.biology - 2014-08-21

The initial data shows the performance of the network when connected via a 1 Gbps network connection to the original OIT core.  In mid-May, the network was migrated to the new core and connected at a speed of 10 Gbps.  However, at that time the Fitz East data center was not yet connected to the new core.  The reduction of network capacity from 1Gbps to 500 Mbps was tracked down and found to be related to the througput of a single stream through the Cisco Source Fire IPS devices used in the new core.   After whitelisting the traffic through the new IPS, the performance between the two servers was improved to about 1.5 Gbps although there was some asymmetry in the traffic rates between the two servers.  On June 9th, the Fitz East data center was moved to the new core network and bandwidth improved to a reliable 2.5 Gbps in each direction.  The only things in the path between the two servers were the SourceFire IPS (which was not inspecting the traffic) and a virtual firewall context.  It was surmised that the 2.5 Gbps limitation on bandwidth was due to the firewall.  The bio-perfsonar-02.biology.duke.edu server was taken off-line and migrated to a new IP address that was in the biology data center but not on the Biology VRF.  When the server was restored to service at the new IP address on July 9th, performance immediately improved to an expected 5-7 Gbps.

Similar data is shown below for the network connection between two servers on the same VRF but in different buildings.

Physics has servers in both the Physics Building as well as the BioSci building data center.  The graph below shows traffic flowing between phys-perfsonar-02.phy.duke.edu and bio-perfsonar-04.phys.duke.edu

PS - bio-perfsonar-04.phy to-from phy-pefsonar-02.phy - 2014-08-21

Both the Physics building and BioSci building were upgraded to 10Gbps and connected to the new core on May 15th (shown in more detail below).  The network between the two buildings immediately improved to delivery of 6-8 Gbps of bandwidth from the earlier limit of 1 Gbps.

PS - bio-perfsonar-04.phy to-from phy-pefsonar-02.phy - 2014-08-21 - DETAIL

It is important to remember that PS shows the available bandwidth, these graphs do not directly show how much is being used.