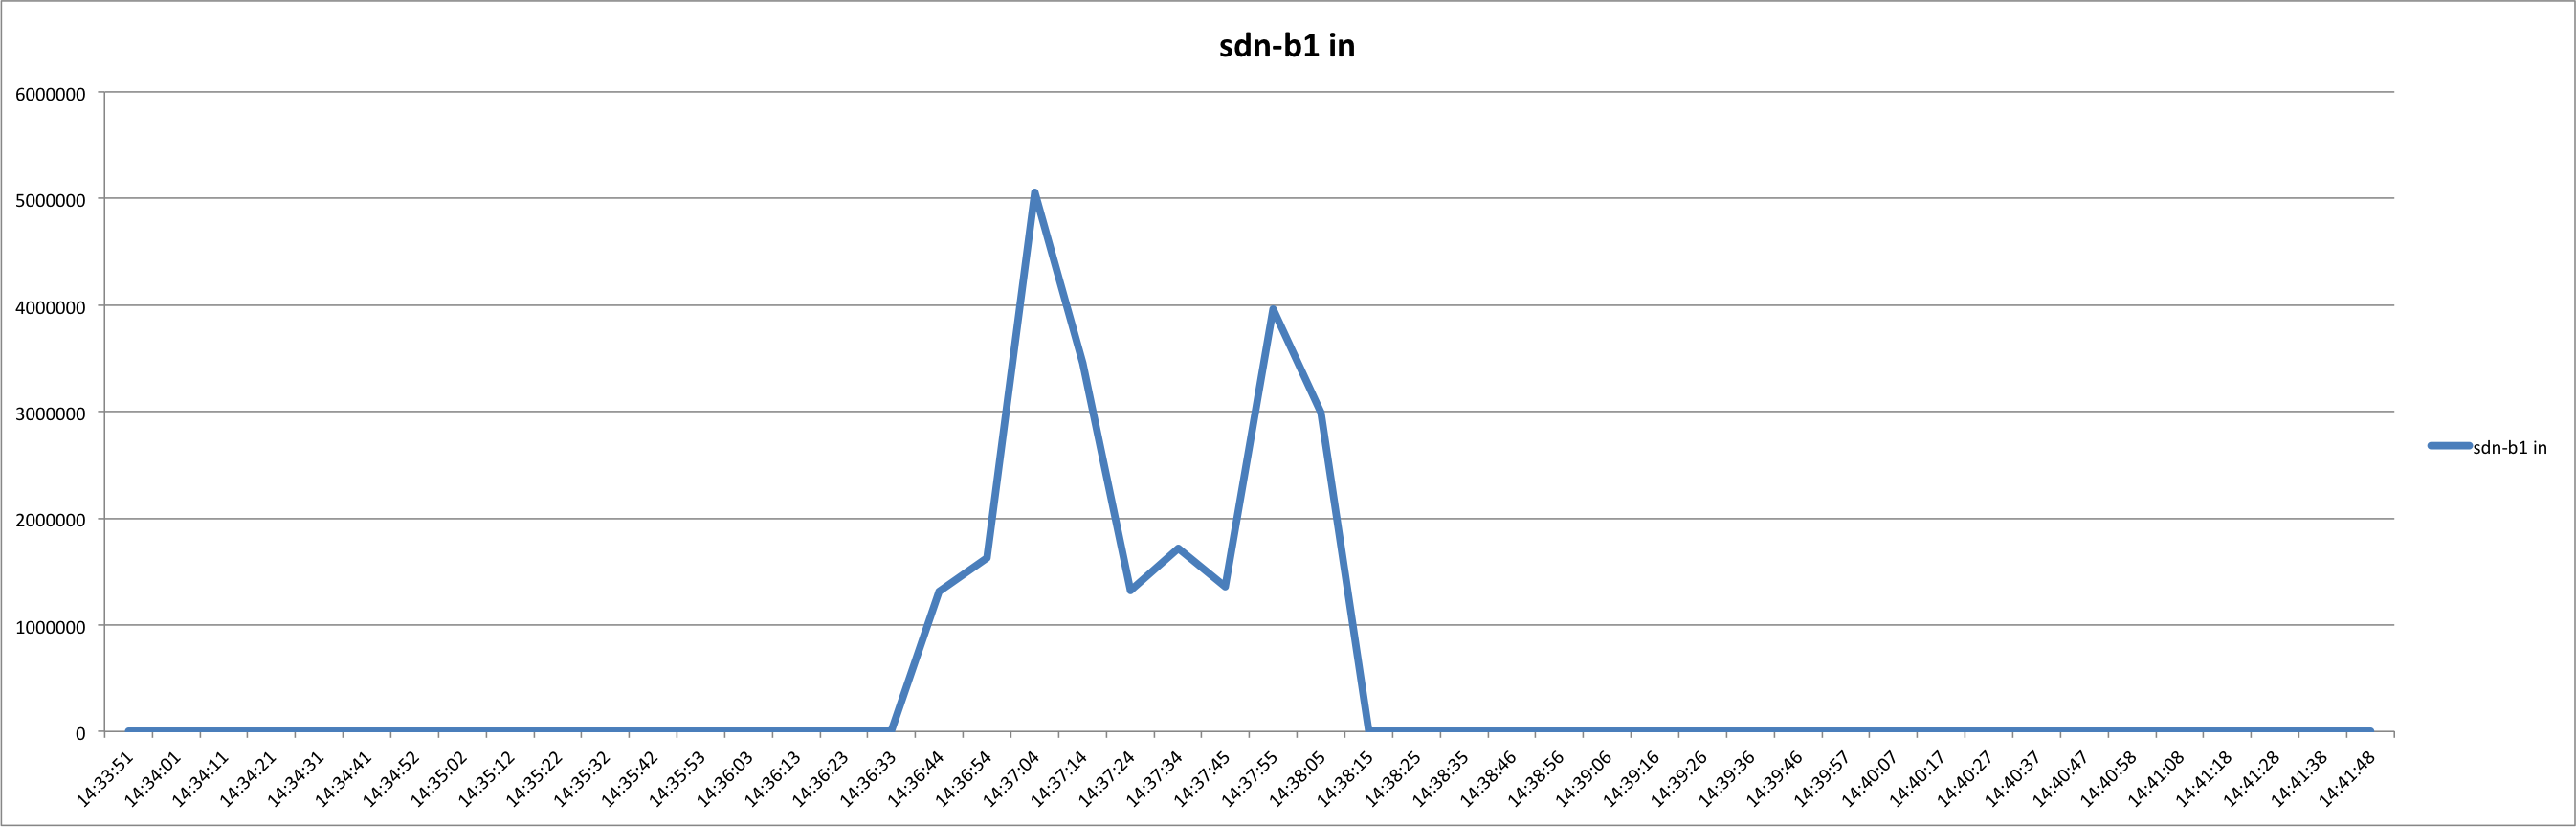

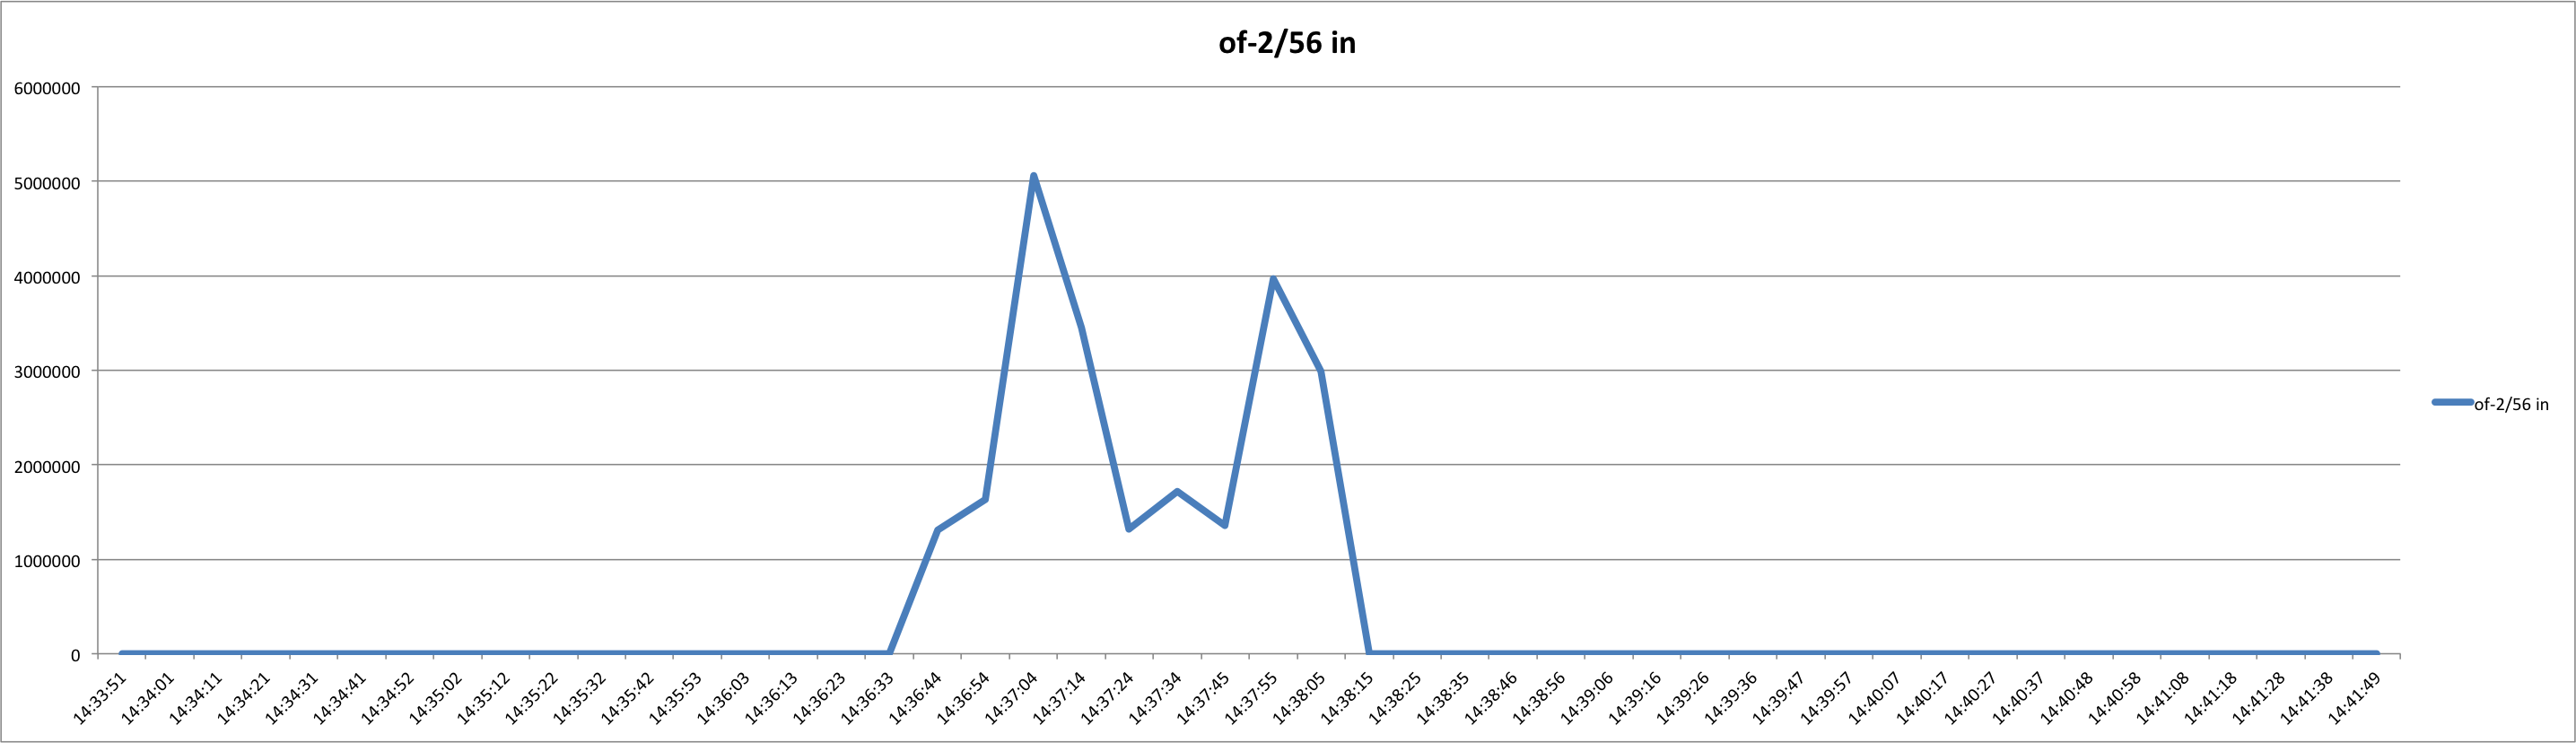


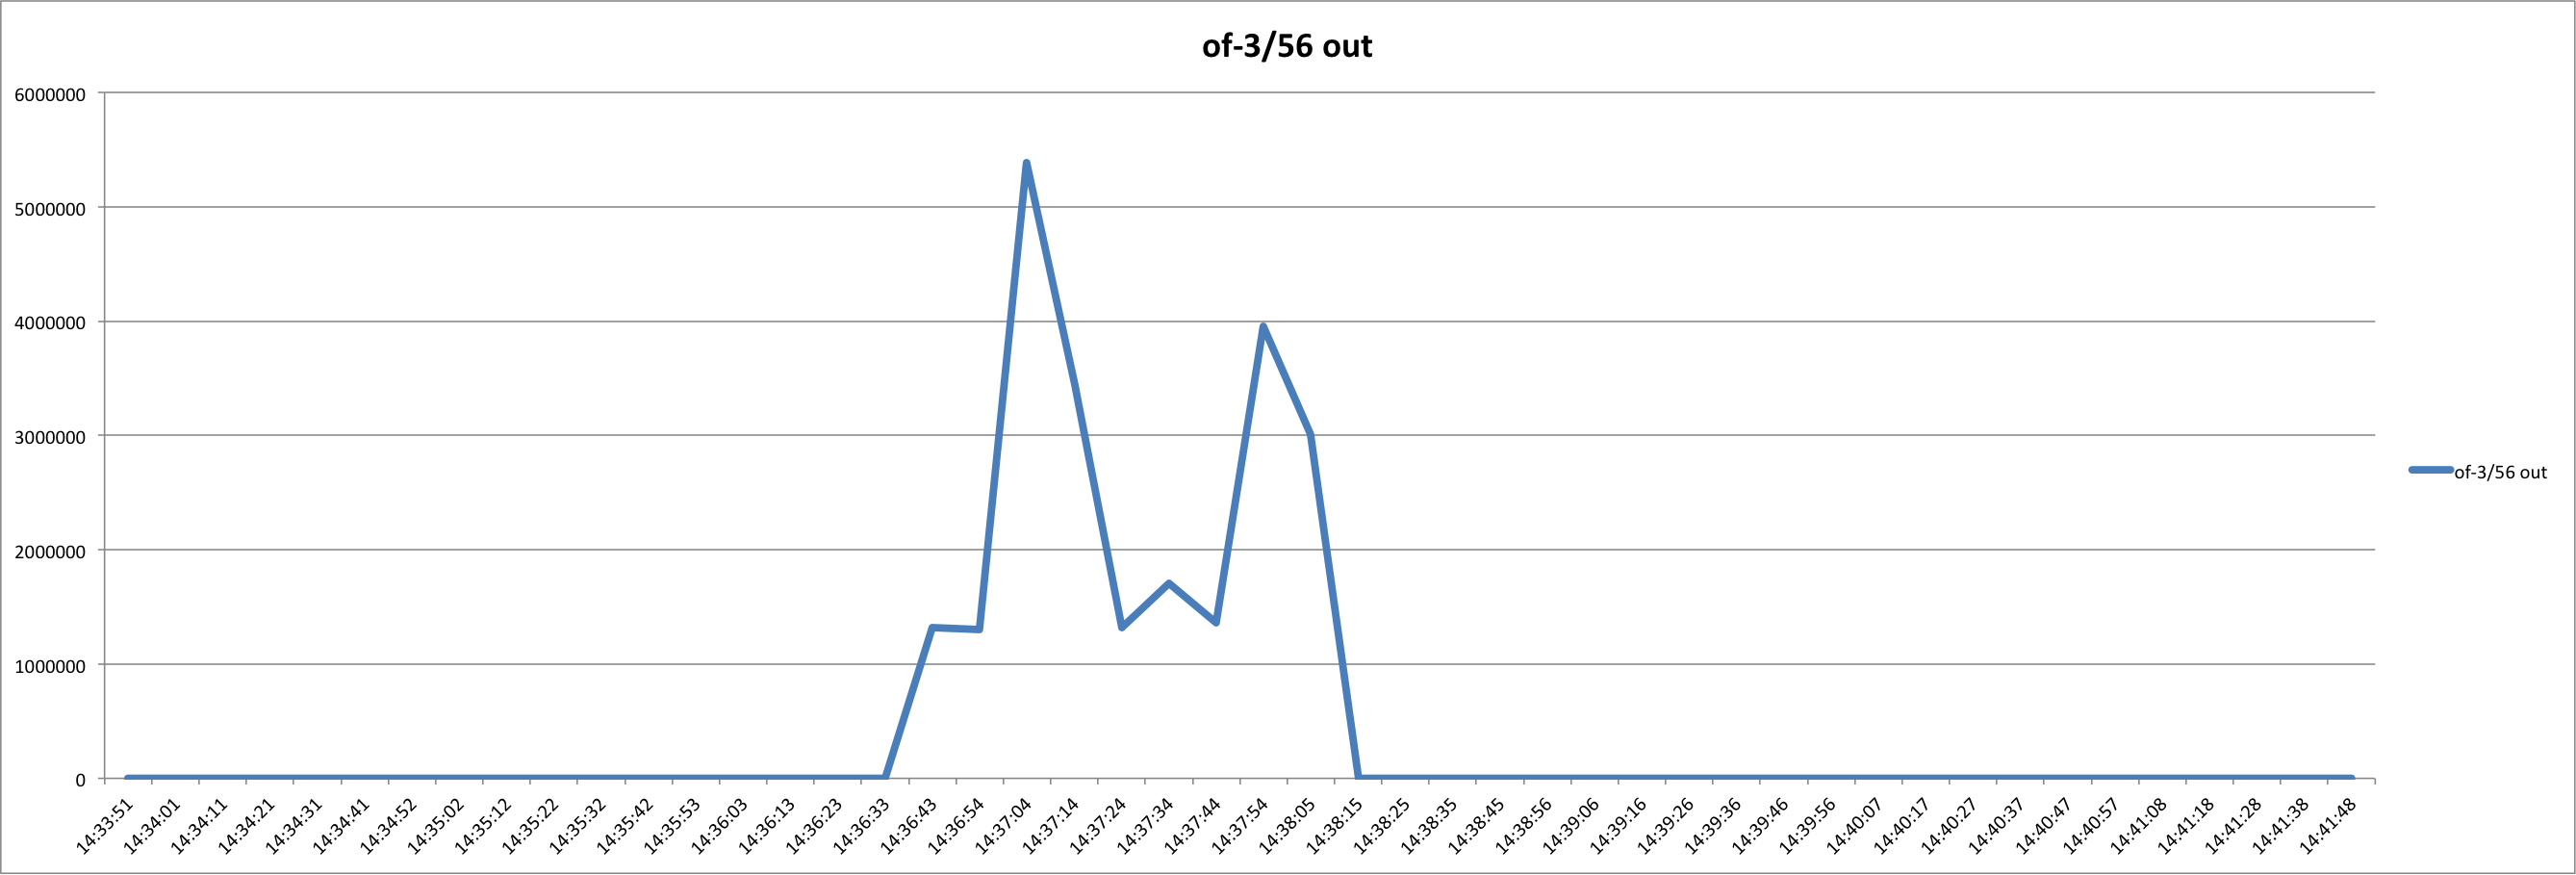


These graphs show the number of packets sent through the switches during 40 repeats of sending a one GB file (1073741824 bits). The series starts at timestamp 14:36:44.
The graphs are named and labeled according to their position on the switches – for example, the port that holds sdn-B1’s connection is labeled sdn-b1. There are both in and out datasets for each port. The “in” dataset shows information coming in to the switch from outside of it, and the “out” dataset shows information being sent elsewhere in the switch for processing.
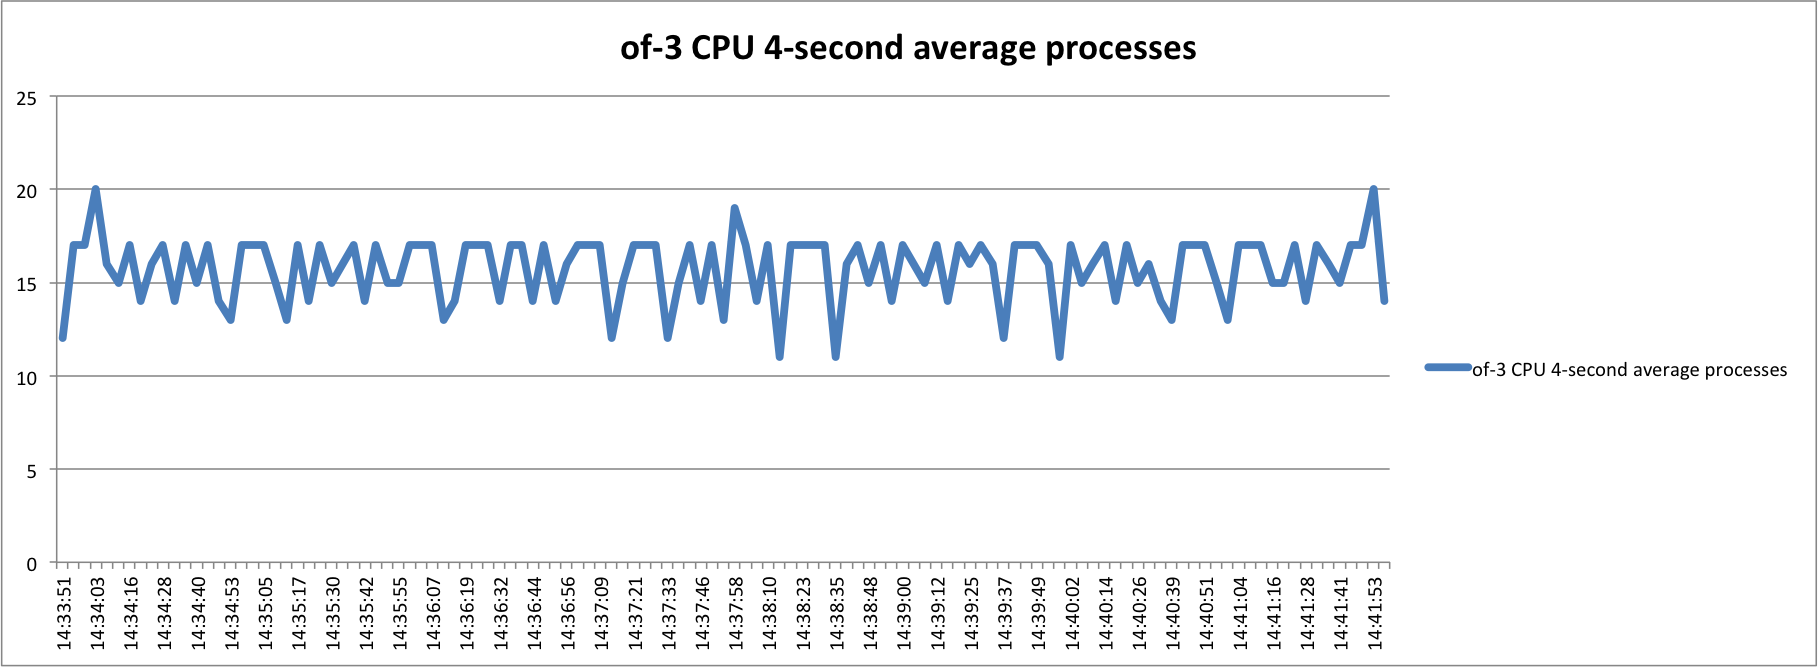
There are also two graphs of CPU load (taken as a 4-second average), one for each switch.