“ConCERNing SDN” — Presentation at Internet2 Global Summit (Victor Orlikowski, 16 May 2016)

Victor Orlikowski presented at Internet2 Global Summit on 16 May 2016 in Chicago about work completed using SDN in support of LHCOne research in the Triangle area. His presentation was entitled “ConCERNing SDN, Or: How Duke and MCNC Collaborated to Speed LHC Data to Research Triangle Physicists Through Software-Defined Networks.”

The presentation is available here.

Richer CoCoA

Our project extends researchers’ powers by making scientific collaborations with computer tools — an increasingly important engine of research enterprise — easier, while also protecting data from being exposed. We seek to rejigger the balance of ease-of-access and privacy protection.

We have focused on building out new means of federating research applications, and over the life of our grant we have extended the concept of “CoCoA” applications. In a sense, we’ve cooked up a richer CoCoA, while keeping constant with the fundamental innovation that the original CoCoA laid out.

What is CoCoA?

In the main, “CoCoA” (“Comanage+Conext+Applications”) has focused on web-based applications, even though “a set of domain tools” could also imply a non-web or more “systems” platform (see this description of CoCoA). The most obvious examples are wikis and shared calendars, as Internet2 points out. CoCoA applications listed by SURFnet (surf.nl; Netherlands) are web-based and quite broad in scope, including “business management,” collaboration, video, and security.

CoCoA is an acronym composed from two perhaps unhelpfully named (and partially acronym’ed) technologies (COmanage and Conext, now OpenConext). But central to CoCoA is the ability to federate access to applications, and the process of rendering (or converting) an application for this manner of consumption on the web is called “domestication.” SURFnet provides a useful definition:

Domestication is described as the process of externalizing authentication, authorization and group management from applications. Domesticated application[s] typically use a[n] external authentication source like for example a SAML based identity federation, and communicate with group management and authorization systems to retrieve additional information on the authenticated user, his/her roles and rights.

Domesticated applications enable single sign-on features for users, as well as the ability to share group context between multiple applications. From the service provider point of view, externalizing identity and group management eases the burden of maintaining these kind[s] of account data.

Federating access is the defining goal, but a problem is having the right things to access

In some sense, having the right things in place for researchers is an issue of history and of habit. Researchers want to dive into their data with tools they know and that have a real relevance and credibility in their disciplines. The trouble? They can’t wait for some tools to be “domesticated” on the web in order for them to become part of the federated universe.

That match of web tool and research task is often delicate, and can get in the way of adoption of web-based and domesticated tools — they are less familiar at least, even though they may be functionally the same as the shrink-wrapped product on the PC.

The tactic that we have taken in “domesticating” whole operating system platforms removes some of the trouble — sociological or psychological though it may be — by placing the federation and authentication steps prior to entry into what is, after all, a familiar place: a Windows or Linux desktop. Though that familiar sight appears within the context of a modern web browser, the feel is familiar and research applications work as usual, as Linux or Windows applications. We have found that the graphics performance is quite acceptable, especially for users who are on Duke campus networks. Even Youtube works, albeit soundlessly since we have not worked on passing audio through the middleware layers that do the tricks.

In a sense, the domestication we have accomplished relies more on glue than on hand crafted parts. Tools already available position the operating system so that displays can render desktops in a modern web browser. The glue is rather complex, as this graphical representation of a system for domesticated Windows machines illustrates:
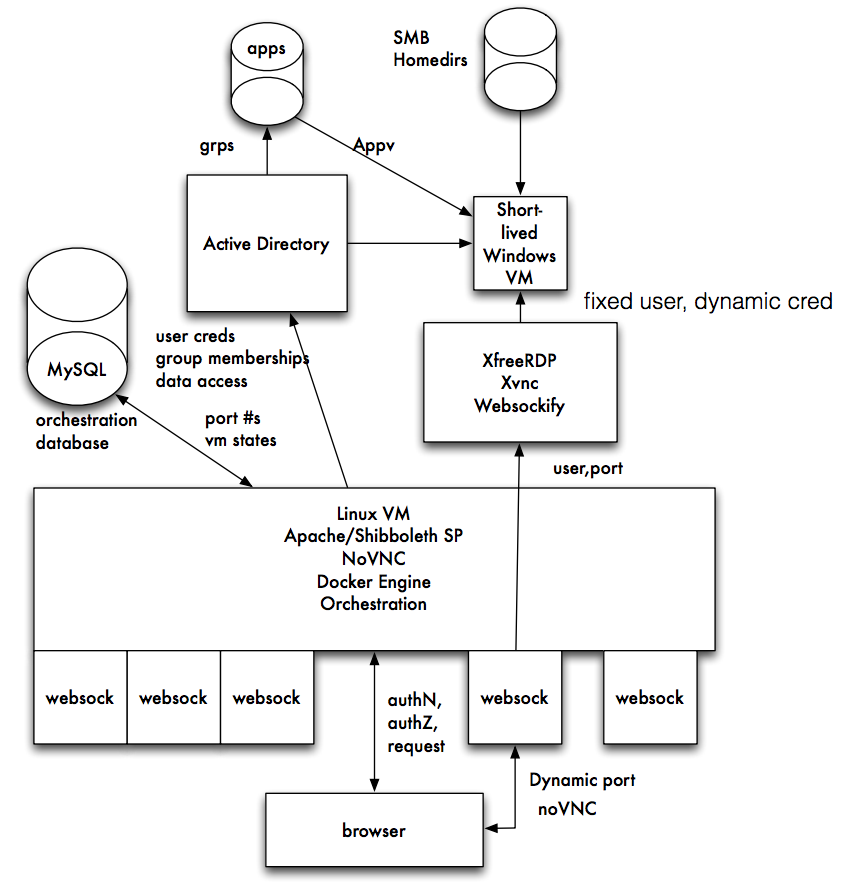
carter-win_in_browser(That schematic appears in a presentation Rob Carter made at Internet2’s Technology Exchange in October 2015. See Federated, Remote, Clientless Windows Access for the complete set of slides.)

The process goes like this:

  1. A user from University A points her web browser (at the bottom of Rob’s illustration) at a page to gain access to a Windows VM offered by University B
  2. University B determines whether the user qualifies for access by seeing whether University B counts her as OK, either by consulting internal records or rules and asking University A to confirm the user’s credentials (Rob’s “authN, authZ request”).
  3. University B maps the user to a temporary username on a virtual machine and passes the desktop of that machine through a system using RDP and VNC to render the desktop to the user in a web browser. The user’s claim on the virtual machine will persist, but the credentials for access to the virtual machine is unknown to the user.
  4. Storage resources required by the user are made available to the temporary user on the Windows machine.
  5. At the close of the session, records of the session are kept, but the temporary username and credentials are destroyed. The virtual machine (now inaccessible with the destroyed credentials) is retained for a certain period, so that the state of the machine persists and can be accessed by the user — though using another set of temporary credentials created for the next session.

One thing that is notable — aside from users witnessing the oddity of seeing a complete Windows desktop in a web browser — is that the authentication mechanisms on the web/client side actually are not directly tied with the authentication mechanisms of the Windows machine. That is, user credentials for access via the web (where the federation takes place) are different from the credentials operating on the Windows machines. In the Duke implementation, Windows-side credentials don’t even persist, but may be limited to single session.  Credentials may live beyond a single login session to allow for long-lived calculations to complete. That connection of authenticated user and user-on-the-machine is done by the glue and by mechanisms that Rob has created to map the Real and Persistent User with an ephemeral counterpart on the Windows machine.

Rob called an early version of the system “Schaufenstern” for good reason: the system separates the “outside” from the “inside” by a sheet of glass, metaphorically speaking, through which you can see but which also prevents direct interaction. (Schaufenstern is German for display windows or shop windows.) That separation has security benefit, for by separating the mechanisms of authentication and coordinating them by other back-end means, computers can be shielded from exploits like “Pass-the-Hash” which exploit the persistence and transmission of credentials in networked Windows systems.

The set up for Linux machines is similar, though a bit simpler to deploy. Mark McCahill has done that, and the system has been in operation for some time now, with hundreds of instances (Docker-ized, of course!) serving both researchers and students.

Another CoCoA, maybe this one a bit tastier

Very fancy, you might say. Very fancy to see quickly deployed and personalized machines appear in web browsers. But how does this make my CoCoA more flavorful?

The point of CoCoA, at its most basic, is to ease collaboration across distances among people who can share common sets of applications. The fundamental resources for that have been developed using the Internet and web technologies, mainly because they are now ubiquitous and are so woven into the practices of research and scholarship. Also, administrative arrangements (constituted in Internet2, for example) have normalized the expectations and many of the tools that underlie trust transactions. Technology and trust together make “federated” authentication feasible.

But feasible doesn’t mean that anyone would want to do it, and thus the range of applications — the “A” in CoCoA — have to be compelling.

We know that researchers of all stripes use computers, and they share data and scripts so that they can experience and witness each other’s work on computers in a sort of rudimentary “collaboration.” We also know that many applications that researchers value have not yet themselves been domesticated for the web — and thus made in scope for federated access on the web.

Our work steps behind the application and in effect domesticates whole sets of applications by making their context — the operating system and its user desktop — the domesticated thing.

SDN Presentation at Winter 2015 Common Solutions Group Meeting

One of the workshop topics at the Winter 2015 Common Solutions Group (CSG) – meeting held at University of California Berkeley from 1/14/15 – 1/16/15 was “Democratizing the Network with Software Defined Networking (SDN)” – details of the workshop are available here:

CSG Workshop

Charley Kneifel and Mark McCahill participated in the workshop and Charley Kneifel gave a presentation on “Dukes SDN Journey”

In addition to the presentation (link below), Mark McCahill gave a demonstration of SwitchBoard which is documented elsewhere on this site. Both Mark and Charley participated in a round table discussion on the topic of SDNs in general.

CSG – Winter 2015 – Duke’s SDN Journey

As always we acknowledge the support of the National Science Foundation –

This Work Supported by NSF on the following grants:

NSF OCI-1246042 – CC-NIE
NSF CNS 1243315 – EAGER

Switchboard and VLAN support

sb 1

Multi-tenant-style VLAN support is now enabled in Switchboard, so in addition to dynamically configuring un-tagged routes, users can also request that Switchboard setup routes over specific VLANs. After the user request has been approved by the appropriate subnet/ip owners, the route is configured. This wraps up phase I of our VLAN support strategy.

How it works

A controller running the Ryu REST Router code can support VLAN tagged traffic, and on the surface this looks simple to support – just add the VLAN tag parameter to the end of the REST URL.
Continue reading

AL2S Network Setup and Testing Summary

In an earlier post I described the setup of the new v3.4 perfSONAR node used to test the AL2S network.  In this post I will summarize the results of the 1 week test done on the AL2S link to UChicago along with a description of the work that Victor did to setup the link.

Setup

The TelCom Arista has a PerfSonar box connected to it, on port 17.
The TelCom Arista *also* has a connection to AL2S, via MCNC, that arrives via port 1.
We share the connection through AL2S with RENCI, and RENCI has allocated us 100 VLAN tags to use (1000-1099, inclusive).

Last week, Victor allocated a 5 Gbps circuit for testing between Duke and Chicago.
It is using VLAN tag 1000 (on our end), and expired at 4 PM on Monday (10/20/14).
AL2S performs a tag flip somewhere in the link, so that our VLAN tag 1000 becomes VLAN tag 3000 at Chicago’s end.

The first thing we did was to test in traditional switch mode.
This meant:
1) Allocating VLAN 1000 on the TelCom Arista
2) Ensuring that port 1 was in trunk mode, and that tags 1000-1099 were allowed
3) Ensuring that port 17 was in access mode for tag 1000
4) Setting up a VLAN interface for tag 1000

We agreed with Chicago to use the private subnet 192.168.10.0/24 for testing.
The VLAN interface on the TelCom Arista was configured to use address 192.168.10.2; the Chicago switch was configured to use 192.168.10.1.
After confirming connectivity between the switches, the PerfSonar boxes at each end were configured with addresses 192.168.10.3 (Duke) and 192.168.10.4 (Chicago).

Once we had done a bit of testing in traditional switch mode, we chose to test the OpenFlow capability, using rest_router.
To set this up, Victor did the following:
1) Add port 1 to the OpenFlow instance on the TelCom Arista
2) Add port 17 to the OpenFlow instance on the TelCom Arista
3) Configure port 17 into trunk mode on the TelCom Arista; ports in access mode do not function in OpenFlow mode
4) Add a vlan tagged interface to the PerfSonar box hanging off port 17; this was accomplished thus:
a) ifconfig p2p1 0.0.0.0
b) modprobe 8021q
c) vconfig add p2p1 1000
d) ifconfig p2p1.1000 192.168.10.3 netmask 255.255.255.0 up mtu 9000
5) Add the private address range to rest_router’s management using curl, thus:
curl -X POST -d ‘{“address”:”192.168.10.254/24″}’ http://sdn-prod-01.oit.duke.edu:8080/router/0000001c7365b107/1000

At this point, packets were being switched onto the AL2S link, within the TelCom Arista, using OpenFlow rules.

Since roughly Tuesday afternoon, perfSonar running measurements against the peer perfSonar box at Chicago.
The bandwidth data has been pretty noisy, both with traditional switching and with OpenFlow.
We expect that there’s some bandwidth contention; and would be curious to see how the results look with bwctl being run in parallel mode within the web interface.
When bwctl is run manually (and explicitly specify the degree of parallelism), we get fairly consistent (and high) results that exceed the requested bandwidth of the link (typically very close to 10 Gbps –

Command Line BWCTL Results:

[root@tel-perfsonar-01 ~]# bwctl -c 192.168.10.4 -P8
bwctl: Using tool: iperf
bwctl: 36 seconds until test results available
RECEIVER START
------------------------------------------------------------
Server listening on TCP port 5239
Binding to local address 192.168.10.4
TCP window size: 87380 Byte (default)
------------------------------------------------------------
[ 15] local 192.168.10.4 port 5239 connected with 192.168.10.3 port 57265
[ 17] local 192.168.10.4 port 5239 connected with 192.168.10.3 port 49730
[ 16] local 192.168.10.4 port 5239 connected with 192.168.10.3 port 58667
[ 18] local 192.168.10.4 port 5239 connected with 192.168.10.3 port 53343
[ 19] local 192.168.10.4 port 5239 connected with 192.168.10.3 port 41485
[ 20] local 192.168.10.4 port 5239 connected with 192.168.10.3 port 55678
[ 21] local 192.168.10.4 port 5239 connected with 192.168.10.3 port 39032
[ 22] local 192.168.10.4 port 5239 connected with 192.168.10.3 port 39575

[ ID] Interval       Transfer     Bandwidth

[ 22]  0.0-10.0 sec  3123445760 Bytes  2488803881 bits/sec
[ 22] MSS size 8948 bytes (MTU 8988 bytes, unknown interface)
[ 17]  0.0-10.1 sec  1780350976 Bytes  1413963232 bits/sec
[ 17] MSS size 8948 bytes (MTU 8988 bytes, unknown interface)
[ 15]  0.0-10.1 sec  1054474240 Bytes  832376766 bits/sec
[ 15] MSS size 8948 bytes (MTU 8988 bytes, unknown interface)
[ 21]  0.0-10.1 sec  1462370304 Bytes  1154438086 bits/sec
[ 21] MSS size 8948 bytes (MTU 8988 bytes, unknown interface)
[ 18]  0.0-10.2 sec  1421213696 Bytes  1117543689 bits/sec
[ 18] MSS size 8948 bytes (MTU 8988 bytes, unknown interface)
[ 20]  0.0-10.2 sec  1135476736 Bytes  890163568 bits/sec
[ 20] MSS size 8948 bytes (MTU 8988 bytes, unknown interface)
[ 16]  0.0-10.2 sec  858259456 Bytes  672128900 bits/sec
[ 16] MSS size 8948 bytes (MTU 8988 bytes, unknown interface)
[ 19]  0.0-10.2 sec  930742272 Bytes  727474666 bits/sec
[ 19] MSS size 8948 bytes (MTU 8988 bytes, unknown interface)
[SUM]  0.0-10.2 sec  11766333440 Bytes  9196648461 bits/sec

Wed Oct 15 14:06:26 EDT 2014

Which shows about 9.2 Gbps which is great.

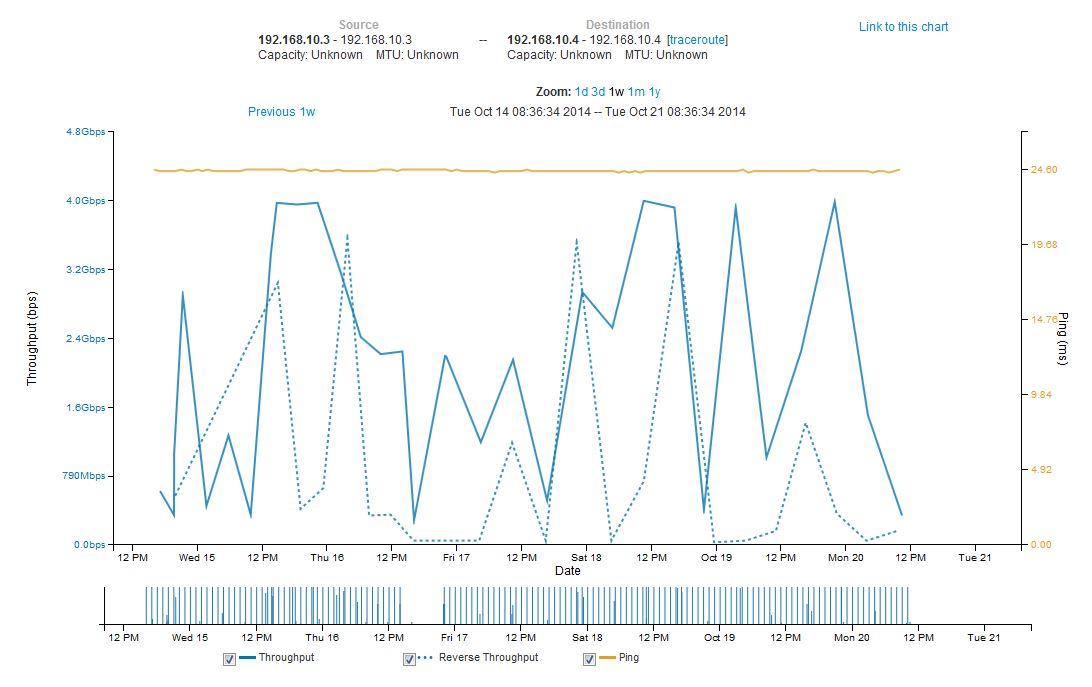
The full results for the bandwidth testing using the perfSONAR GUI is shown below:

perfSONAR results - tel-perfsonar-01 to 192-168-10-4 (Chicago) - 2014-10-21 - Final - Full Week

A couple of items to note –

  1. General variation of the bandwidth – inbound and outbound bandwidth over the link to the UChicago perfSONAR node varied broadly.
  2. Consistency of ping times – the ping times from tel-perfsonar-01 (192.168.10.3) to the UChicago node (192.168.10.4) where rock solid at 24.6 msec and did not vary when the Arista switch was in normal mode vs. OpenFlow mode.
  3. The lack of data between 4PM and 10 PM on Thursday 10/16/14 was due to Charley incorrectly setting the IP address on the primary network interface (p2p2) which Victor fixed late Thursday evening.

perfSONAR v3.4 Deployment

The default image for perfSONAR v3.4 from Internet2 (http://www.perfsonar.net/ download from http://software.internet2.edu/pS-Performance_Toolkit/ )  was used to rebuild tel-perfsonar-01.netcom.duke.edu.

This version of perfSONAR (released 10/7/14) supports using multiple NICs on the server and allows you to control which port is used for a given test.  Bandwidth testing can use NIC1 and latency testing can use NIC2 which allows the use of a single server for both tests.  This change will allow us to run perfSONAR in more locations on campus as we will not need to deploy perfSONAR nodes in pairs (one for latency and one for bandwidth).  We have not found that doing latency tests between nodes on campus is helpful, but latency measurement from off-campus hosts has proven to be useful.

The installation was done from CD and the netinstall method was used.  The “full install” did not work.  Installation was completed on Tuesday 10/14/14 around 1:30

perfSONAR Configuration

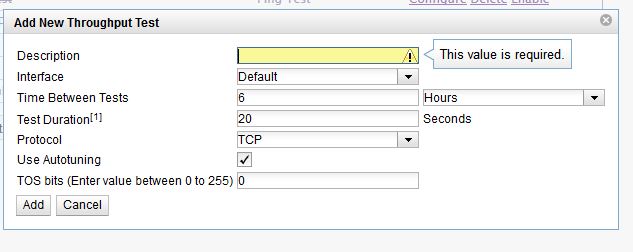
As noted above, the interface used for a test can be selected when a test is created:

Name the test:

perfSONAR configuration - 10-20-14 #1

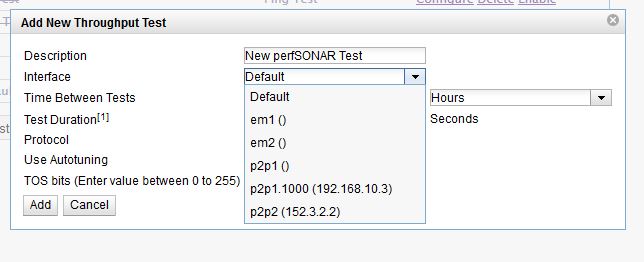
Then you can choose the interface to use for the test from the drop-down menu:

perfSONAR configuration - 10-20-14 #2

In this case, the interface list on tel-perfsonar-01 shows all of the  interfaces on the box – the two built in 1G interfaces (em1 and em2) along with the the 10G interfaces (p2p1 and p2p2).  Note that the p2p1 interface also include the VLAN 1000 tagged interface that Victor defined for testing with UChicago and AL2S.  But that’s another post (Updated 10/21/14)

The interface for results display has also changed with version 3.4 – the old system provided a number of different screens to look at the various test results –

perfSONAR results - tel-perfsonar-01 to 192-168-10-4 (Chicago) - 2014-10-20 - Final

Note above the consolidation into a single graph of the bandwidth (axis on left) and the ping response times (axis on right) along with the line below which indicates when a test was run.

The graph above is for ping and bandwidth between tel-perfsonar-01 and a perfSONAR node mapped into the AL2S network by UChicago.  The ping times are very consistent but there is a lot of variation in the bandwidth.

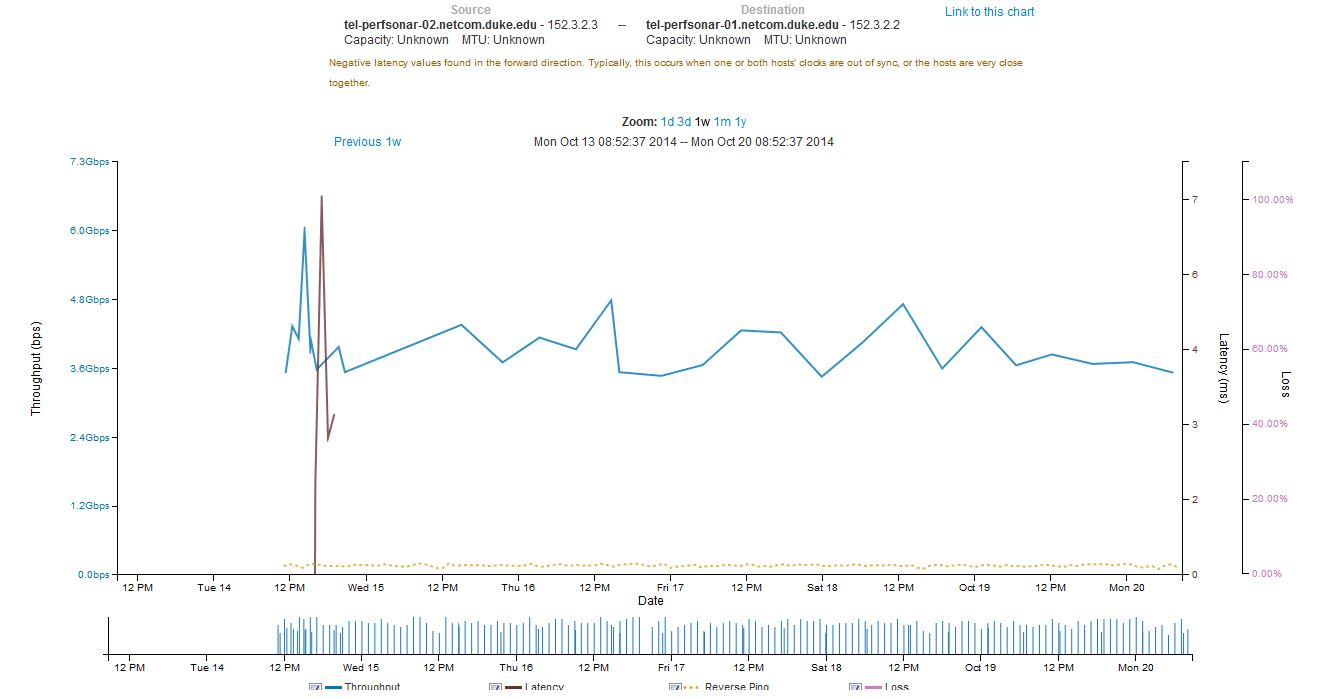
The graph below is for bandwidth between tel-perfsonar-01 and tel-perfsonar-02.

perfSONAR results - tel-perfsonar-01 to tel-perfsonar-02 - 2014-10-20 - Final

Note the general consistency of the runs for bandwidth between those hosts.  THis test was configured to use the interface (p2p2) which is mapped to the production network connection:

perfSONAR configuration - 10-20-14 #3


Switchboard with Cisco 4500 and Arista Switches

Now that we can demonstrate the latest version of Switchboard working with real hardware (from two different vendors) on the production campus network, it seemed like time to celebrate the event with an update on Switchboard and some screen captures of a demo walkthrough.

bypass

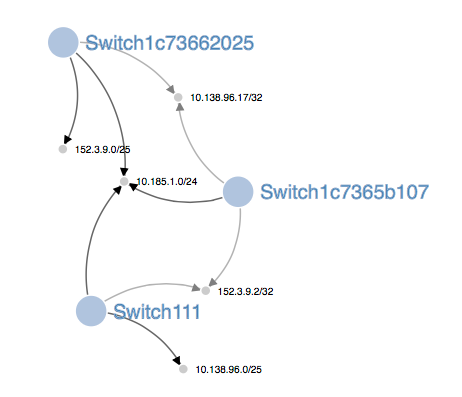
bypass network configured connecting 10.138.96.17 and 152.3.9.2

Maintaining State Across SDN Controller Restarts

User-driven reconfiguration of the SDN network means that we have an interesting problem: how to we restore the state of the network in the event of a reboot (or crash) of the SDN controller?

Switchboard addresses this issue by caching the commands it has issued to the controller in a mysql database table. To restore the state of the SDN network after a controller restart, we simply replay the commands in order. Since these commands include user-requested route adds and deletes, getting back to a given state is straightforward.

To automate recovery from SDN controller restarts, the controller startup script could wait until the controller has started up, then make a REST request to Switchboard to trigger playback of the command cache and so restore state.

Continue reading

Switchboard

Switchboard-config

What is Switchboard?

Switchboard is a web application designed to allow researchers to quickly set up and tear down links across an SDN network that bypasses the core campus network — think of this as a high-speed expressway that you might take to avoid the congestion of  downtown.

To do this, Switchboard allows authorized users to request links (routes) to be configured across an SDN network. Because links may cross administrative boundaries, Switchboard supports a simple workflow for approving link requests. After a given link request has been approved, Switchboard makes REST web services calls to an SDN controller running the RYU REST web services controller code to configure the SDN switches.

Switchboard is a user-facing service for researchers and others who are not SDN network experts that

  • accepts users’ network configuration change requests
  • routes the requests for authorization
  • logs approvals of requests
  • updates the configuration of the SDN network
  • logs changes to the SDN network configuration

How does Switchboard work?

To properly authorize link requests, Switchboard maintains in it’s database, a map of users/groups who can authorize link requests for specific IP addresses/subnets. This map is created by the Switchboard application administrators, although it could also be driven from an external database of roles and address space ownership.

Continue reading

Planned Updates to perfSONAR Topology

The perfSONAR nodes deployed across campus provide two primary sets of measurements – Latency and Bandwidth.  In our testing since the beginning of the year, we have gotten greater insights into the campus network from the bandwidth measurements than the latency measurements.  The latency measurements for wide area connections to Singapore (both the I2 and Duke services) and along the path to Singapore have been useful.  The latency measurements on campus often show “negative latency” due to the precision of the clock synchronization between the two servers.

Originally we had deployed pairs of perfSONAR nodes inside of departmental networks. We plan to re-deploy the boxes that are solely used for latency measurements to other places on the Duke network.  We also will reserve one of the Dell servers for ad hoc deployments to campus locations to help debug performance issues.

As noted earlier, we have seen value for latency measurements done outside of the Duke campus and will be keeping servers for latency measurements in Telcom and Fitz East.  We are also looking to confirm that we can use both NICs in the Dell servers to be able to simultaneously measure bandwidth and latency on the same box.  Note that this does require two 10G network connections in target data centers/buildings closets which should not be connected to over subscribed 10G network ports.

Ultimately we will end up with:

  1. Loaner/Test Server
  2. Bandwidth and Latency Measurement – Outside of all networks (edge/perimeter)
  3. Bandwidth and Latency Measurement – Campus Data Center
  4. Bandwidth and Latency Measurement – Inside network, outside of MPLS core
  5. Bandwidth and Latency Measurement – AL2S Network
  6. Bandwidth in Physics DC on Physics VRF
  7. Bandwidth in BioSci DC on Physics VRF
  8. Bandwidth in BioSci DC on Biology VRF
  9. Bandwidth in Library DC on Library VRF
  10. Bandwidth in DSCR on DSCR VRF


perfSONAR Topology

Using the CC-NIE funding, OIT has deployed 10 physical servers as perfSONAR (PS) around the campus.  These servers are generally deployed in pairs – one of which handles bandwidth measurements and one of which handles latency measurements.  In order to validate local switch performance, there has been some “mixing” of bandwidth and latency measurements in the infrastructure.

We plan to re-do our configuration using the latest PS build which should allow us to combine bandwidth and latency measurements on the same server using different NICs.

The current servers are:

Server Location VRF Primary Role Notes
tel-perfsonar-01.netcom.duke.edu 0200 Telcom Bldg No VRF
(Outside)
Latency CC-NIE Server
tel-perfsonar-02.netcom.duke.edu 0200 Telcom Bldg No VRF
(Outside)
Bandwidth CC-NIE Server
fitz-perfsonar-01.oit.duke.edu Fitz East DC DataCenter General Purpose OIT
Networking
fitz-perfsonar-02.oit.duke.edu Fitz East DC DataCenter Latency CC-NIE Server
fitz-perfsonar-03.oit.duke.edu Fitz East DC DataCenter Bandwidth CC-NIE Server
bio-perfsonar-01.biology.duke.edu BioSci DC Biology Latency CC-NIE Server
bio-perfsonar-02.biology.duke.edu BioSci DC Biology Bandwidth CC-NIE Server
phy-perfsonar-01.phy.duke.edu Physics DC Physics Latency CC-NIE Server
phy-perfsonar-02.phy.duke.edu Physics DC Physics Bandwidth CC-NIE Server
bio-perfsonar-03.phy.duke.edu BioSci DC Physics Latency CC-NIE Server
bio-perfsonar-04.phy.duke.edu BioSci DC Physics Bandwidth CC-NIE Server
singapore-perfsonar-01.oit.duke.edu Singapore DC Public Bandwidth VM
singapore-perfsonar-02.oit.duke.edu Singapore DC Private Bandwidth VM

The servers listed above give us the ability to test:

Traffic between servers in different buildings on the same VRF
Traffic between servers in the same building on different VRFs
Traffic in and out of the primary data center (Fitz East)
Traffic in and out of the edge of the network (Telcom Servers)
Traffic in and out of server in the Singapore DC