
One recurring theme we see is that the results in enacted maps are “baked in.” That is to say that over a wide range of elections changes in the votes do not lead to changes in the partisan make up of the representatives elected. This effect was very pronounced in the N.C. Congressional maps used in 2012 and 2016 . The enacted maps (NC 2012 & NC 2016) produce the same result over a large range of elections. These elections have varying statewide vote fractions; the ensemble shows that the number of elected Democrats change as the elections change, whereas the enacted plans nearly always give the same result.
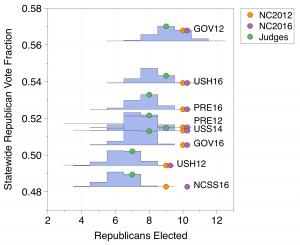
Here we have shown a number of historical elections and arranged them on the plot from most Democratic to most Republican. We see that as the Republican vote fraction increases the blue histograms show that the typical number of seats elected by our ensemble of 24,000 or so maps shifts towards the Republican direction. The number of Republican seats elected by the Beyond Gerrymandering Judge’s map responds to the shifting public opinion by shifting the number of Republicans elected. The Enacted plans from 2012 and 2016 don’t change over a wide range. In the enacted plan, the loss of support for a party does not result in the loss of seats. In the ensemble and the judges plan, the loss of support for a party causes that party to lose seats.
This effect can be understood in the box-plot graphs of the ordered marginal plots.

The large jump in the plot, which leads to a range of election results for which the partisan outcomes don’t change, was has been referred to as the “Signature of Gerrymandering.”