
Our team is due to get some new computers this month and we have narrowed our choices into an equivalently specced PC and iMac. To best decide between these options, I’ve found a few free-to-use tools that have helped me gather some data on which computer would best fit our needs. Though benchmarking was a new experience for me, I found these tools to be intuitive and straightforward.
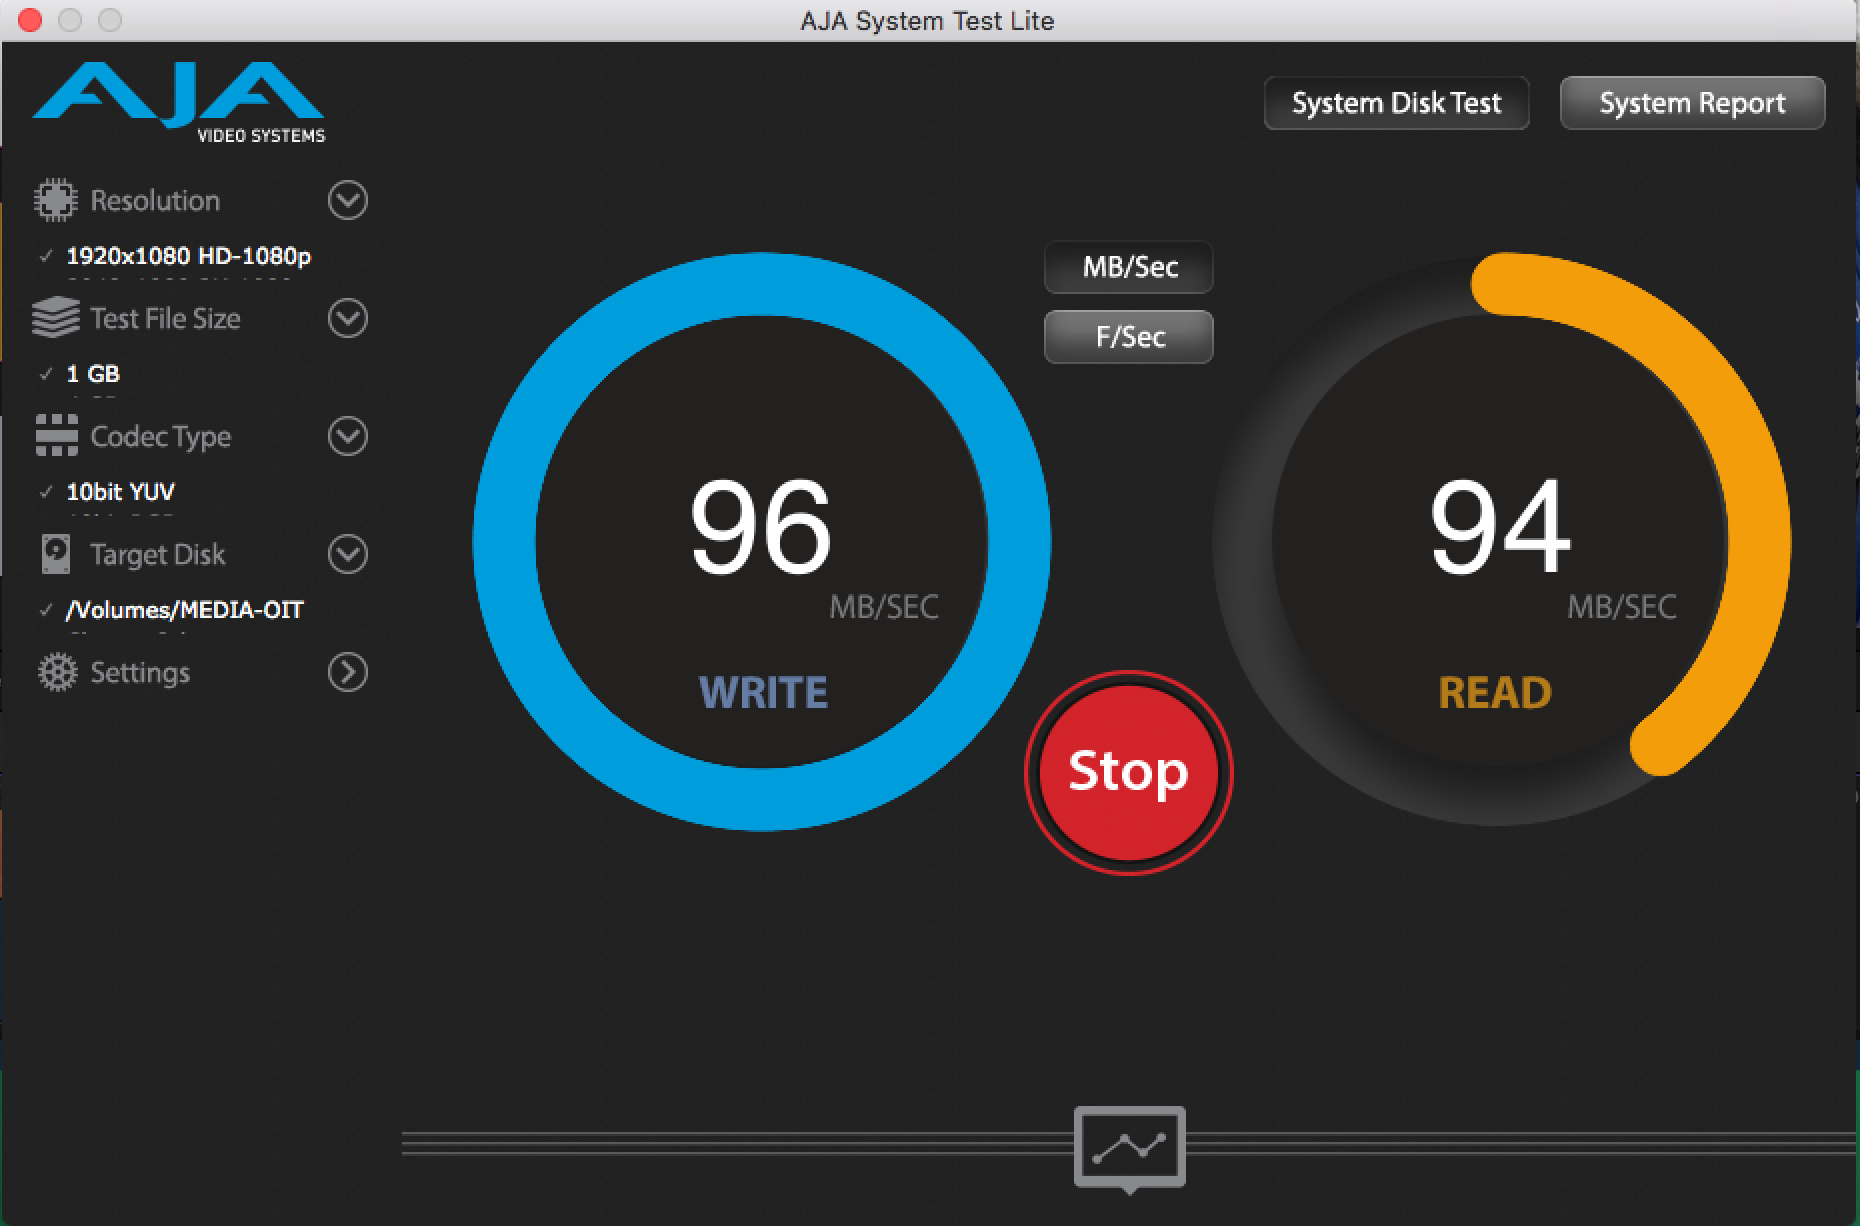
AJA Systems Test – This tool, which works on both Mac and PC, allows the user to test the read/write speed of the hard drive or any connected drives. Most of our video projects are edited directly off of network attached storage so ensuring that our R/W speed off network is correct was the first step in accurately evaluating the computers’ performance. The Blackmagic Disk Speed Test also works for the purpose, but is only available on Mac.
GeekBench – For our work, single-core processing performance was the most important comparison. This cross-platform tool was perfect for testing the performance of the CPU, generating separate scores for performance on single-core and multi-core. There’s also more granular data for specific scenarios such as adding a Gaussian Blur, Speech Recognition, PDF rendering, etc. The scores may vary slightly if you run the test multiple times but they’re helpful for determining relative differences between machines. The GeekBench website also provides comparative data from tests that other users have run.
NovaBench – This tool provides a more well-rounded assessment, providing scores for RAM, GPU, Disk as well as CPU. It was good to get a second opinion of sorts on the CPU, but the scores between this and GeekBench aren’t directly comparable. And though editing in Premiere Pro is mostly reliant on processor speed, it can also use GPU acceleration for certain tasks, so it was helpful to have a point of comparison on that level as well.
FurMark – Speaking of the GPU, this GPU stress test was helpful though it’s only available for the PC. Additionally, it includes a CPU burner tool that essentially runs the CPU up to 100% of it’s capacity. In both cases, FurMark pushes your system to it’s limits – if the screen starts blinking or your machine shuts down, you’ll know there’s a problem. Better to find out now than in the middle of an intensive project.
Performance Monitor and Activity Monitor – On Windows 10, the Performance Monitor, amongst other things, generates a real-time graph of the percentage of processor time. When exporting a video from Premiere, or playing that video back in a video player, it was helpful to see how intensive these tasks were on the system. The built-in Activity Monitor application on Mac provides a similar overview.